存储控制器故障导致RAC数据库
ORA-600[kclchkblk_4]错误故障修复

大家好,我是黄伟老师。前几天,一位网友的数据库因为双存储控制器故障,导致一套跑在该存储上的Oracle11gR2 RAC数据库异常,出现ORA-600的错误,数据库无法正常启动,影响业务系统的正常使用和生产,于是找我帮忙处理。处理完这个case之后,现在我把当时的情景尽可能的还原出来,录制成这个视频,希望各位观看学习之后,将来如果在你的工作中,也出现类似的数据库故障,可以起到一个参考指导的作用,提供一个分析的思路,帮各位快速定位和恢复启动数据库。当然,这里面会涉及到一些Oracle数据库的运行原理和一些专业术语,比如SCN、Checkpoint,不过我会尽可能尝试着把它们讲清楚。

一 首先,接到帮助请求

二 分析错误和定位问题

对于不熟悉Oracle错误的同学,可以参考metalink(Oracle官方技术支持网站)官方文档(What is an ORA-600 Internal Error? (Doc ID 146580.1))的解释:

什么是ORA-600?

*ORA-600 errors are raised from the kernel code of the Oracle RDBMS software when an internal inconsistency is detected or an unexpected condition is met. This situation is not necessarily a bug as it might be caused by problems with the Operating System, lack of resources, hardware failures, etc.

With the ORA-600 error comes a list of arguments in square brackets. The first of these arguments tells us from where in the code the error was caught and thus is the key information in identifying the problem. This argument is either a number or a character string. The remaining arguments are used to supply further information (e.g. values of internal variables etc).

Whenever an ORA-600 error is raised a trace file is generated and an entry written to the alert.log with details of the trace file location. Starting with Oracle Database 11g Release 1, the diagnosability infrastructure was introduced which places the trace and core files into a location controlled by the DIAGNOSTIC_DEST initialization parameter when an incident, such as an ORA-600 is created. For earlier versions, the trace file will be written to either USER_DUMP_DEST (if the error was caught in a user process) or BACKGROUND_DUMP_DEST (if the error was caught in a background process like PMON or SMON). The trace file contains vital information about what led to the error condition.*

所以,我们从错误信息参数中,可以猜测出,ORA-00600: internal error code, arguments: [kclchkblk_4]应该是跟数据块错误有关的可能性很大。再结合这个案例,网友提供的信息说存储控制器故障,猜测多半情况下,数据库在运行(数据库进程通过内存空间,频繁和存储设备读写数据)的过程中,存储控制器一旦故障,多数情况下会导致内存中的脏数据(被修改过的数据)无法写入数据库,或者数据库检查点信息无法同步到控制文件、日志文件、数据文件中。那么数据库必死无疑,无法再继续工作下去了,当我们下次手工启库、或者数据库自动重启的过程中,数据库在open阶段,如果数据库无法完成一致性校验或者Instance Recovery实例恢复,那么数据库就无法Open,不能对业务系统提供服务了。

那么,本案例中,这个ORA-00600: internal error code, arguments: [kclchkblk_4]究竟表示什么意思呢?后面的几个参数又表示什么呢?我想,如果我们能把这几个参数搞清楚的话,那么这个问题也许就有眉目了。

于是,从metalink上找到跟该错误有关的几篇文章:

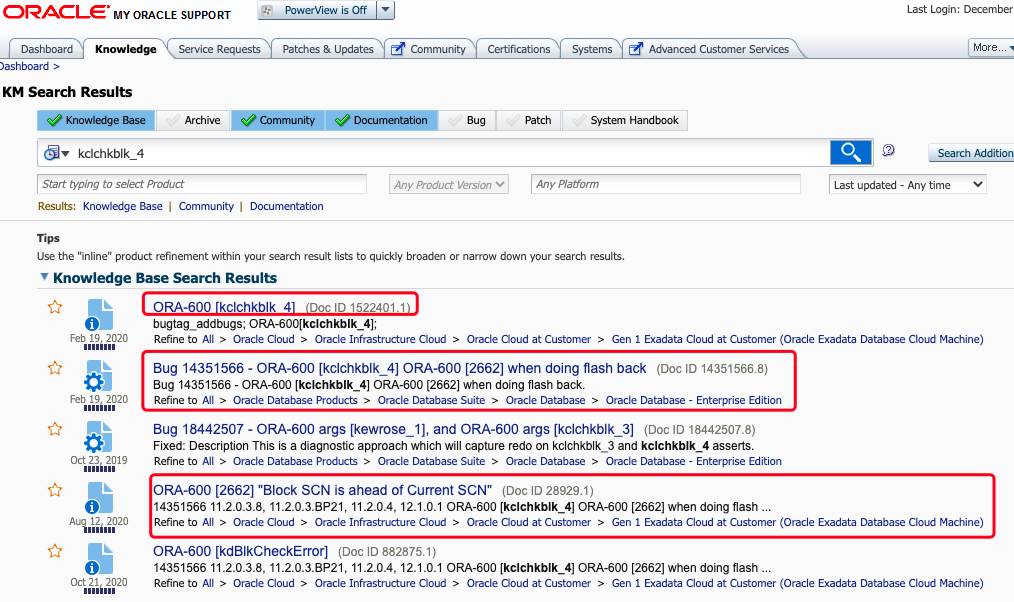
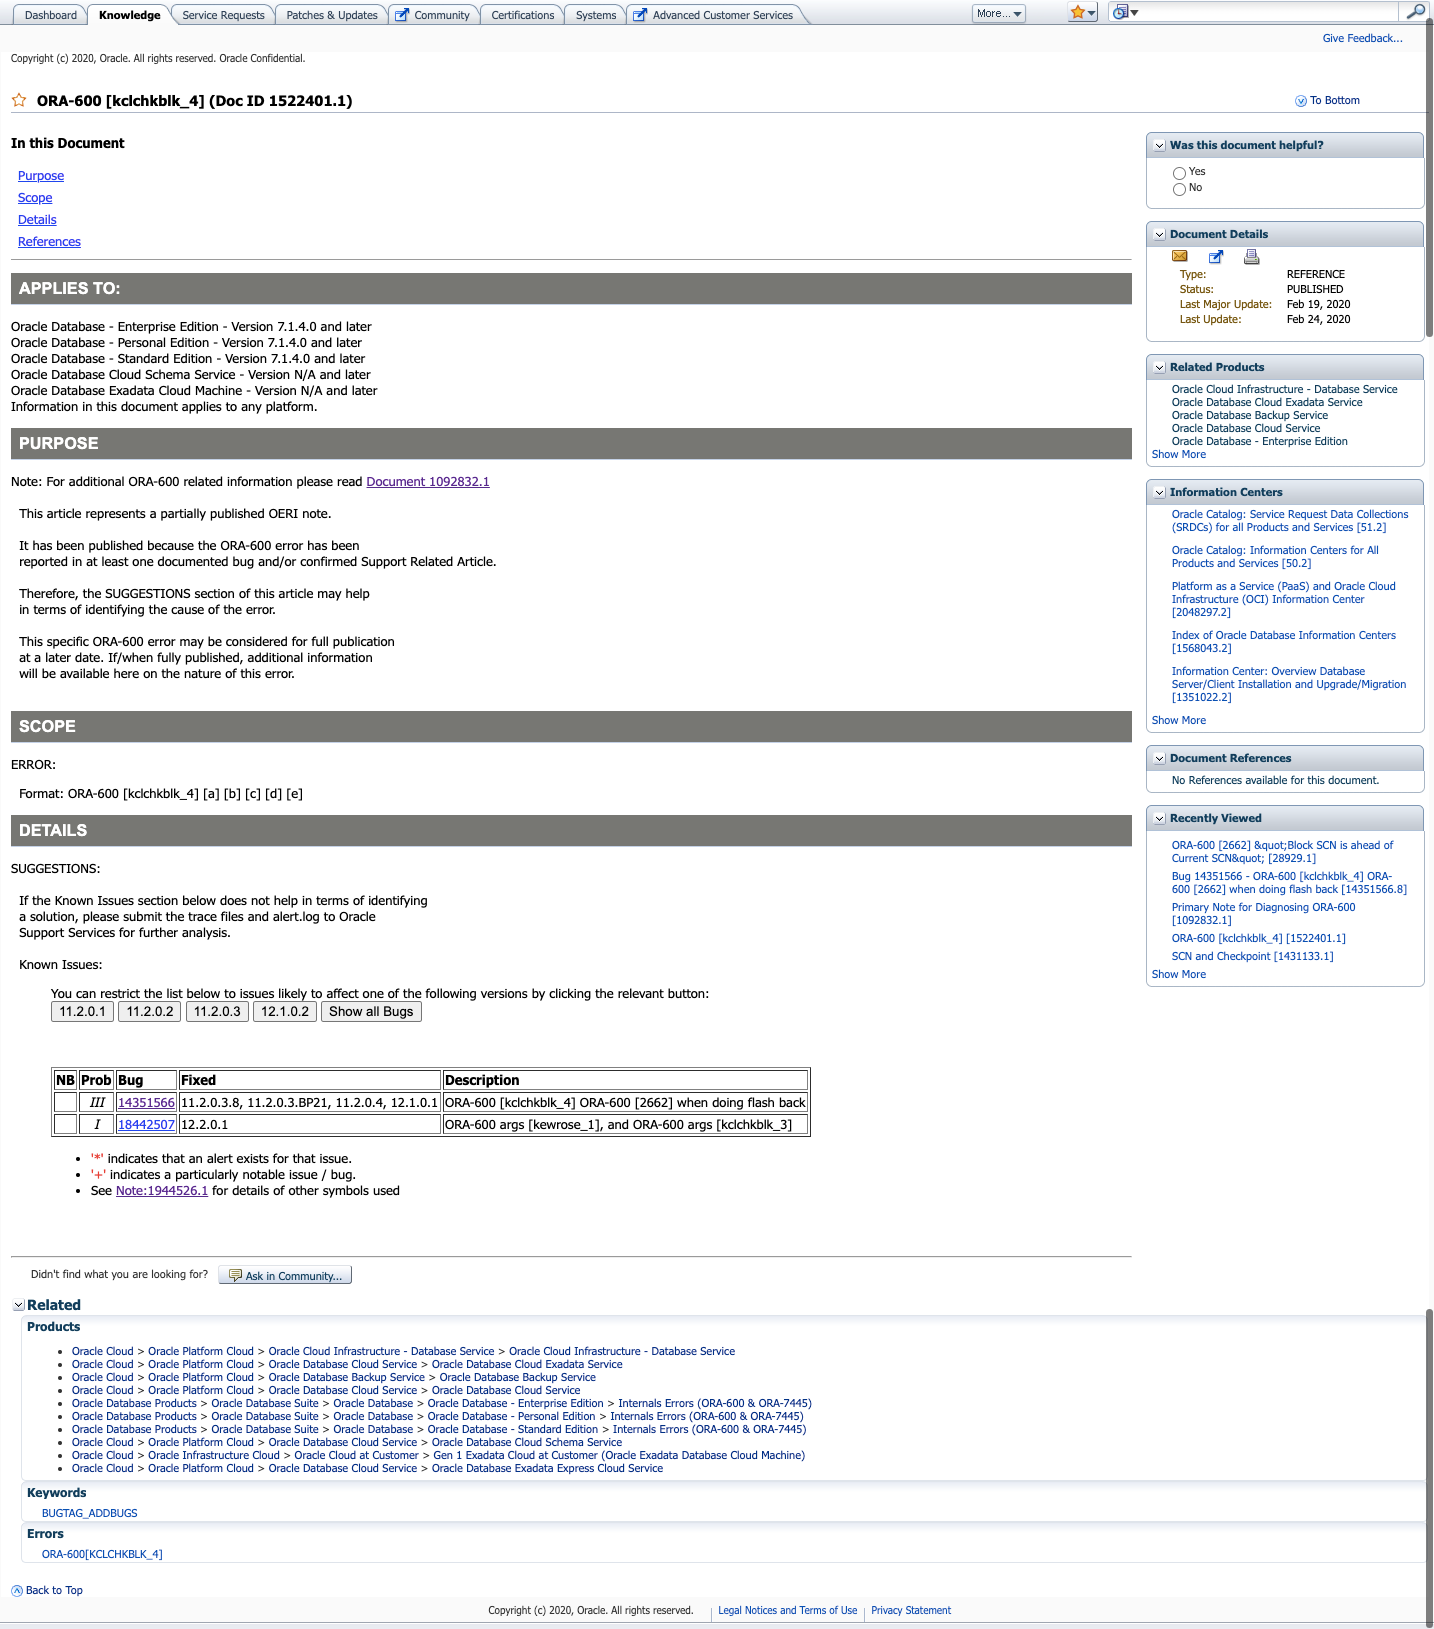
1 ORA-600 [kclchkblk_4] (Doc ID 1522401.1)

ORA-600 [kclchkblk_4] (Doc ID 1522401.1)这篇文档中,获取的信息有限,只是说:目前该错误并没有完全公开发布出来,因为它通常伴随ORA-600错误出现,而且被认为是已知确认的bug。

2 Bug 14351566 – ORA-600 [kclchkblk_4] ORA-600 [2662] when doing flash back (Doc ID 14351566.8)

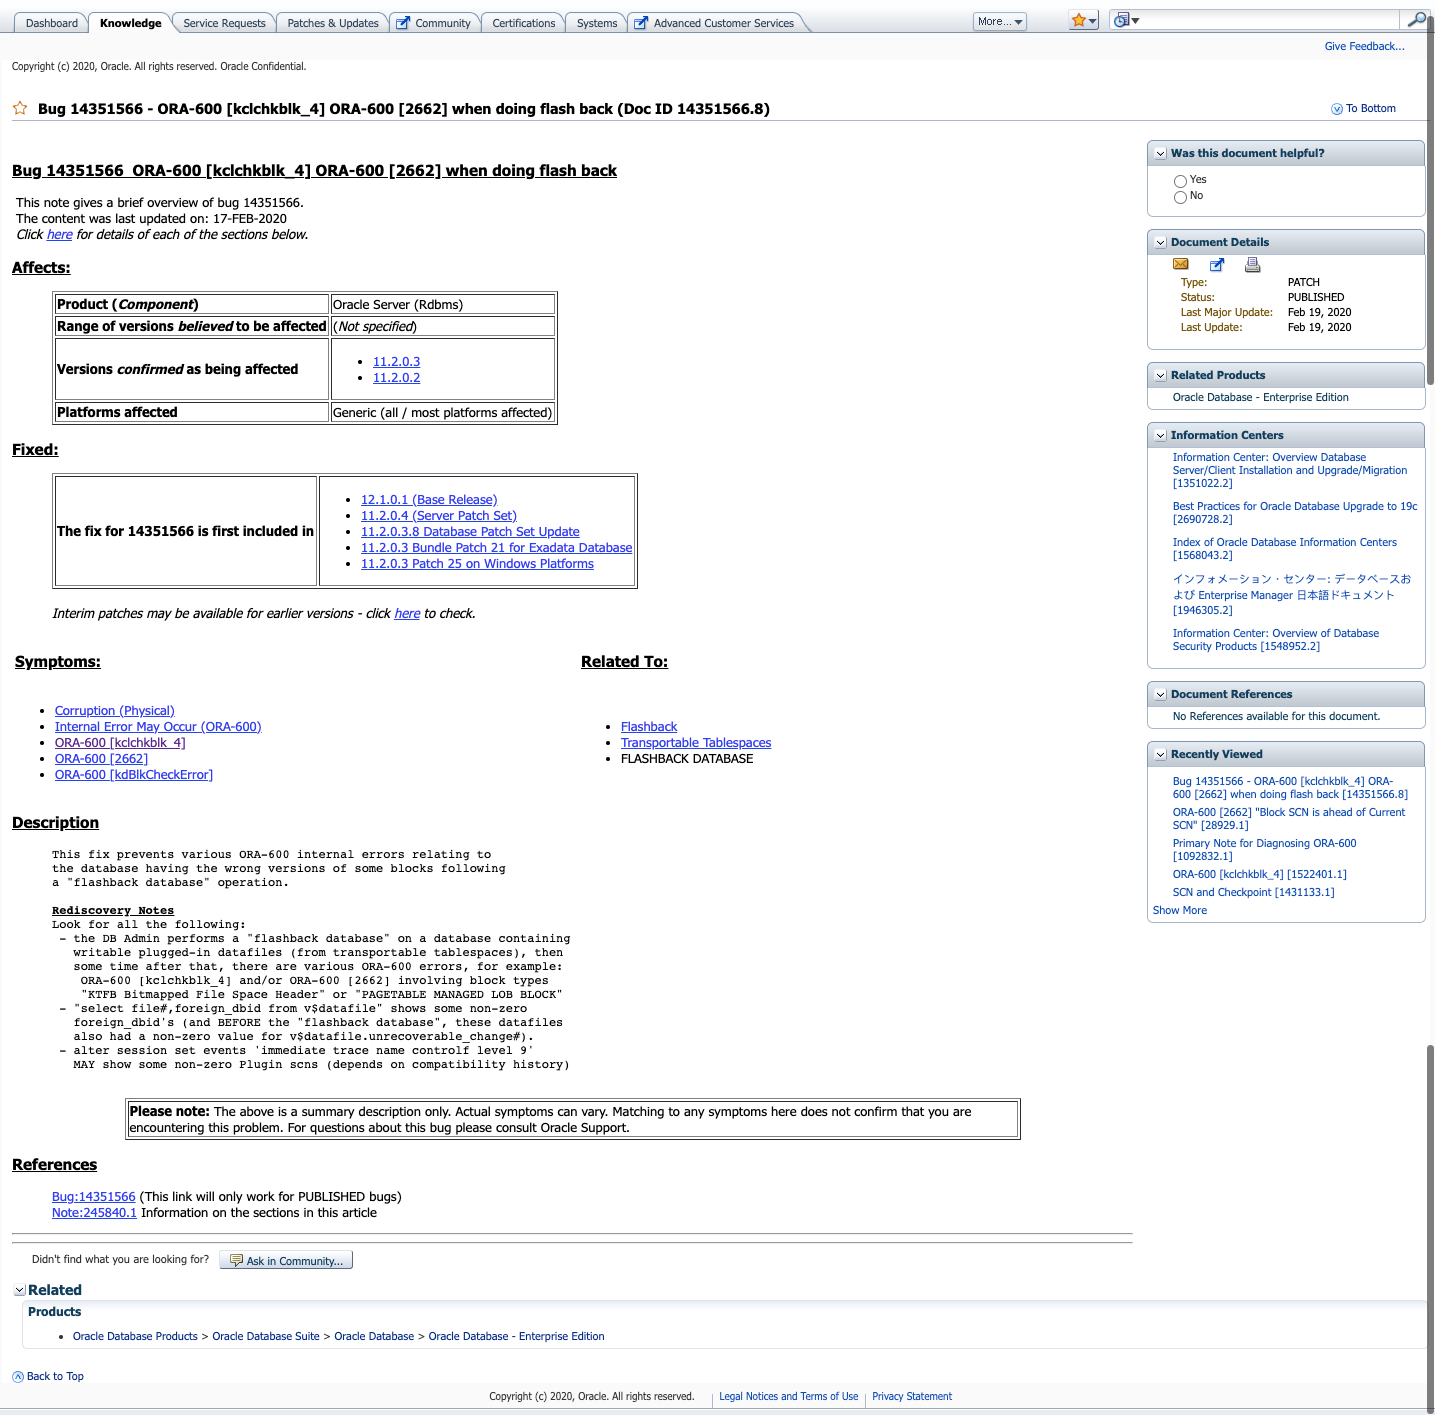
该文档描述的是数据库多次执行flashback之后,导致的bug。我们该故障场景中,数据库并没有执行flashback的操作,排除。

3 ORA-600 [2662] “Block SCN is ahead of Current SCN” (Doc ID 28929.1)


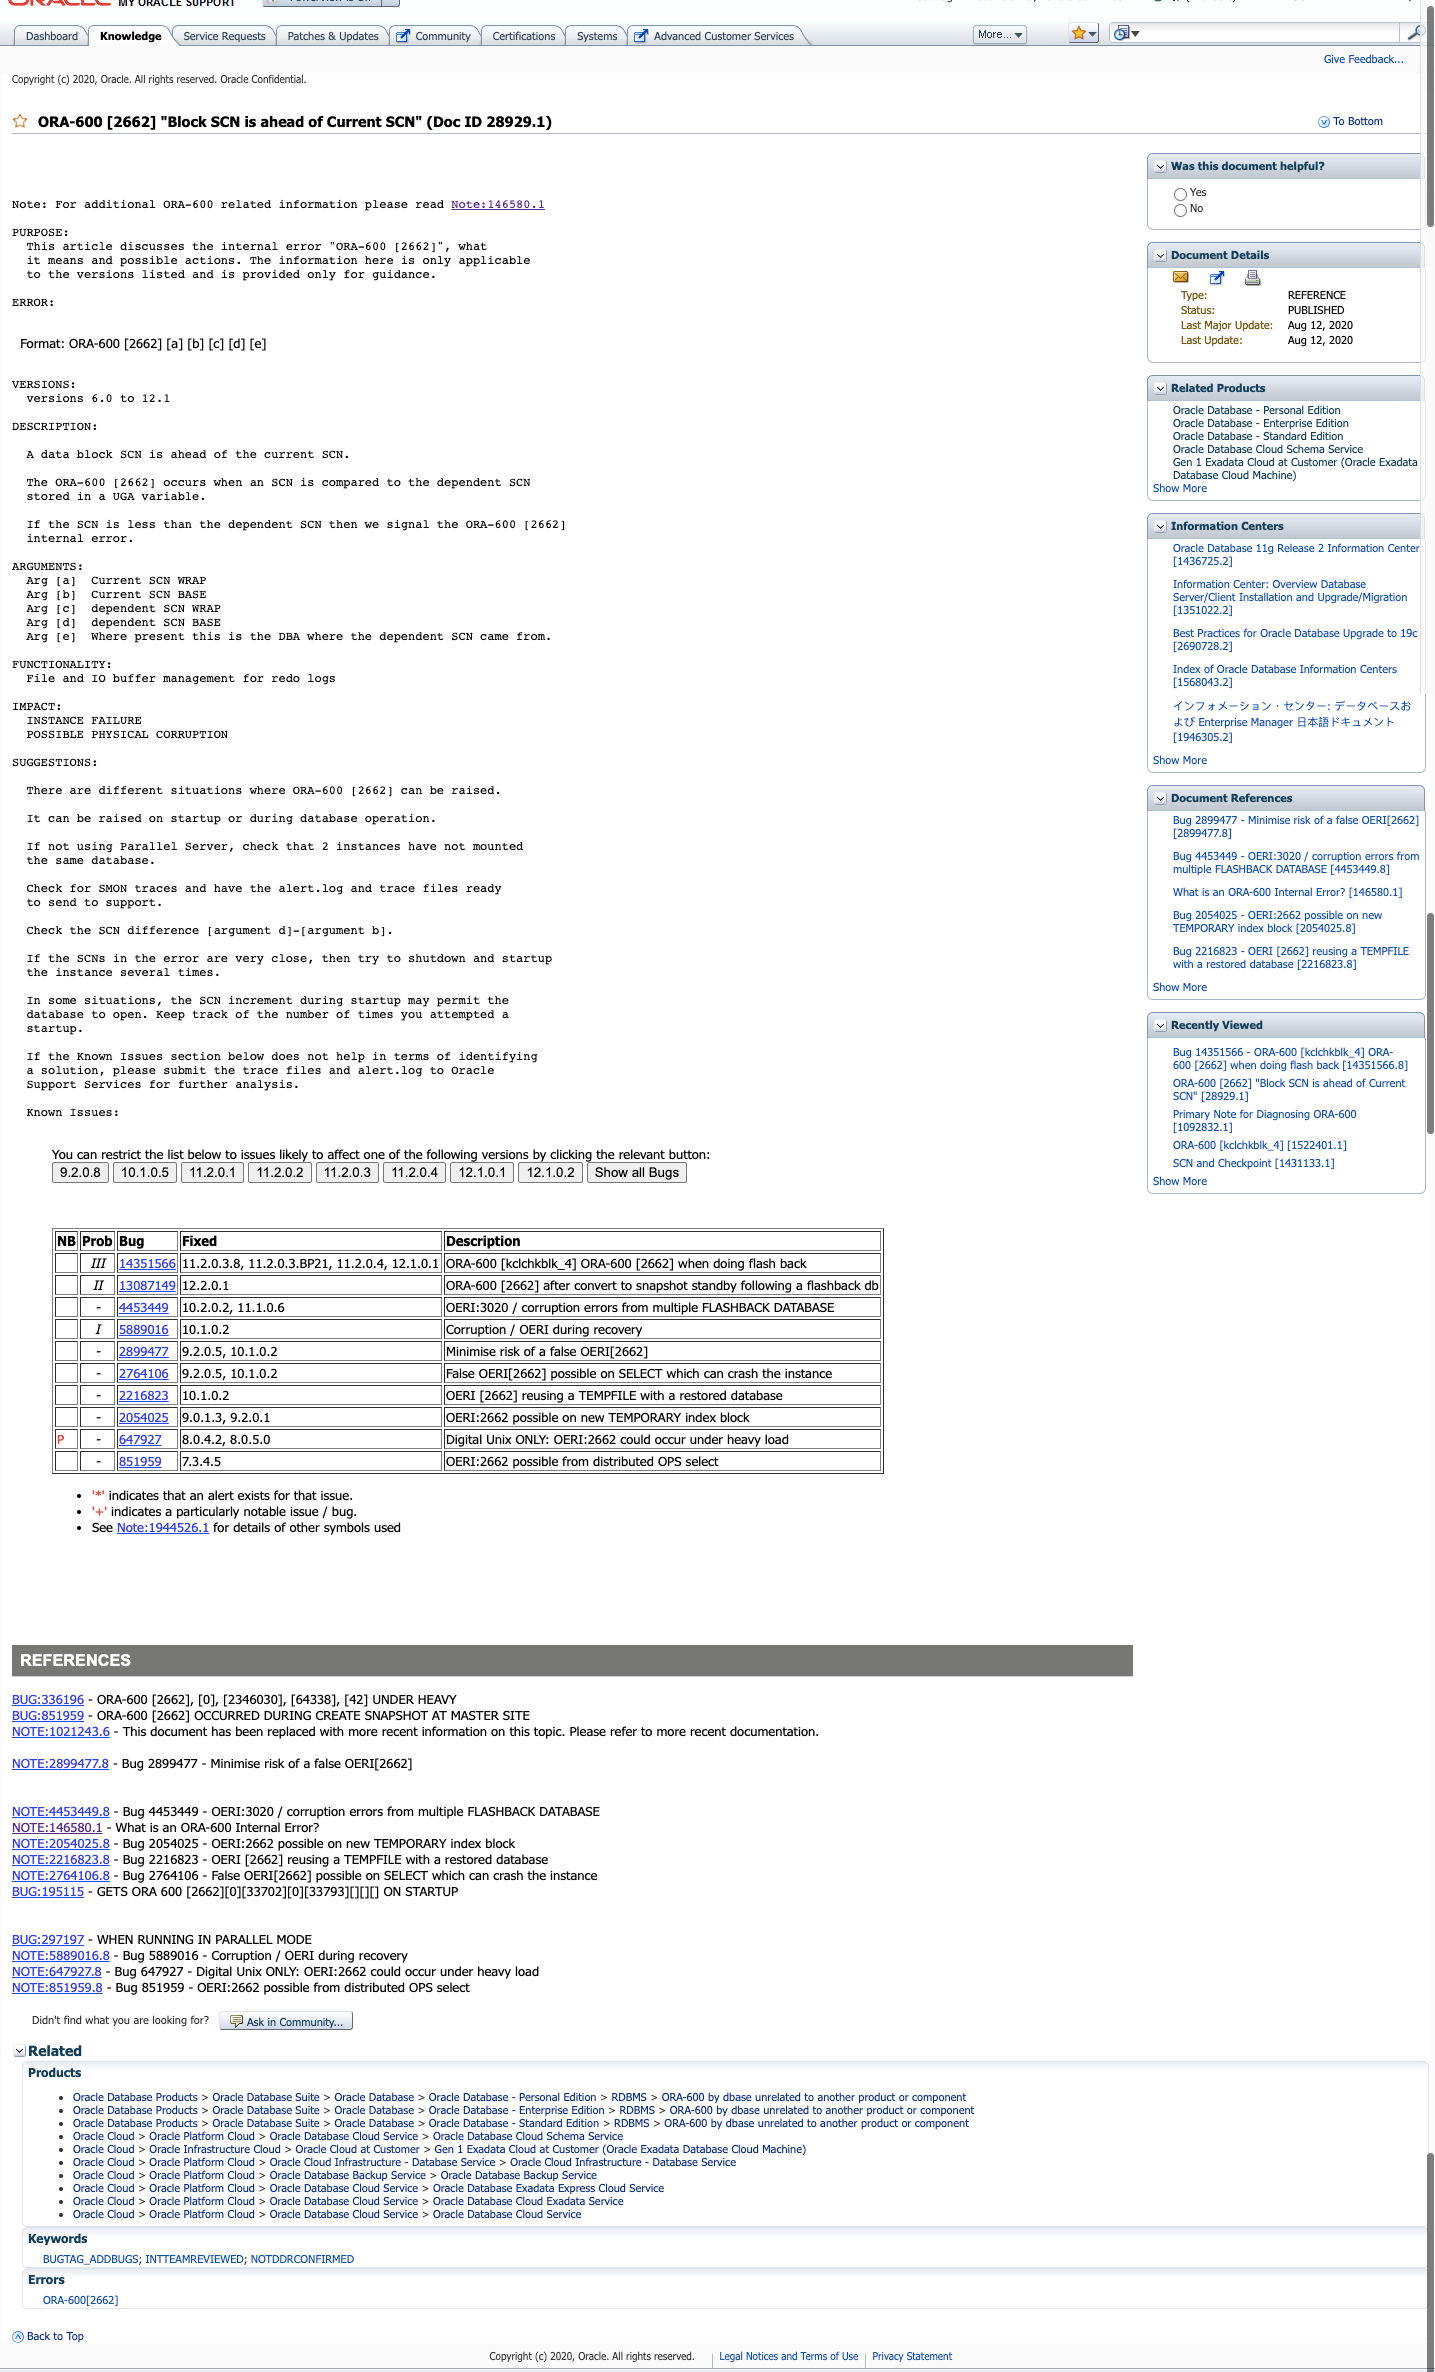
不过,从该指导文档中可以获取到对此案例有用的指导信息。

① 该错误比较常见,通常由于存储故障、或者服务器异常掉电,数据库abort关闭等,导致的数据块里记录的SCN与数据库当前SCN不一致导致的。解决问题的常规办法就是通过redo log恢复数据,如果依然不奏效的话,可能需要通过非常规手段来修改数据库的SCN,使之一致,进而避免该错误发生。

这里,我在一套测试环境上模拟了该错误,并且手工修复了该错误:

Sat Dec 19 08:55:28 2020
SMON: enabling cache recovery
Errors in file /u01/app/oracle/diag/rdbms/orcl/orcl/trace/orcl_ora_8251.trc  (incident=28953):
ORA-00600: internal error code, arguments: [2662], [0], [112587826], [0], [112587881], [4194432], [], [], [], [], [], []
Incident details in: /u01/app/oracle/diag/rdbms/orcl/orcl/incident/incdir_28953/orcl_ora_8251_i28953.trc
Errors in file /u01/app/oracle/diag/rdbms/orcl/orcl/trace/orcl_ora_8251.trc:
ORA-00600: internal error code, arguments: [2662], [0], [112587826], [0], [112587881], [4194432], [], [], [], [], [], []
Errors in file /u01/app/oracle/diag/rdbms/orcl/orcl/trace/orcl_ora_8251.trc:
ORA-00600: internal error code, arguments: [2662], [0], [112587826], [0], [112587881], [4194432], [], [], [], [], [], []
Error 600 happened during db open, shutting down database
USER (ospid: 8251): terminating the instance due to error 600
Instance terminated by USER, pid = 8251
ORA-1092 signalled during: alter database open resetlogs...
opiodr aborting process unknown ospid (8251) as a result of ORA-1092
Sat Dec 19 08:55:33 2020

当然,这是另外一个case,我们暂且不去聚焦这个ORA-600 26662的错误如果解决。如果大家感兴趣且有需求的话,我可以另外录制一个视频去讲解它。

②从该文档中,倒是给出了有意义的错误参数:

ARGUMENTS:
Arg [a] Current SCN WRAP
Arg [b] Current SCN BASE
Arg [c] dependent SCN WRAP
Arg [d] dependent SCN BASE
Arg [e] Where present this is the DBA where the dependent SCN came from.

可以看出,这些错误参数,跟前面提到的错误参数格式非常一致:

RROR:

Format: ORA-600 [kclchkblk_4] [a] [b] [c] [d] [e]

但是,Oracle官方并没有给出这里的几个参数表示的具体意义。

那么,进一步猜测,我们这个故障的错误是不是也可以借鉴于该文档中给出的suggestion来尝试恢复呢?

③ 官方给出的几个suggestion


SUGGESTIONS:        
     
  There are different situations where ORA-600 [2662] can be raised.

  It can be raised on startup or during database operation.

  If not using Parallel Server, check that 2 instances have not mounted
  the same database.

  Check for SMON traces and have the alert.log and trace files ready
  to send to support.

  Check the SCN difference [argument d]-[argument b].

  If the SCNs in the error are very close, then try to shutdown and startup
  the instance several times. 

  In some situations, the SCN increment during startup may permit the 
  database to open. Keep track of the number of times you attempted a 
  startup.

到这里,有了一个可以尝试的解决问题的思路了,如果ORA-600 [kclchkblk_4] [a] [b] [c] [d] [e]这里的几个参数也表示某种与SCN有关的信息的话,那么,是不是可以根据该建议尝试恢复呢?

三 解决问题

1 start instance,确认错误参数是否推进

Tue Dec 08 15:04:02 2020
Thread 1 advanced to log sequence 9 (thread open)
Thread 1 opened at log sequence 9
  Current log# 1 seq# 9 mem# 0: +DATA/jhzmpr/onlinelog/group_1.262.1045198071
  Current log# 1 seq# 9 mem# 1: +DATA/jhzmpr/onlinelog/group_1.263.1045198071
Successful open of redo thread 1
MTTR advisory is disabled because FAST_START_MTTR_TARGET is not set
Tue Dec 08 15:04:02 2020
SMON: enabling cache recovery
SUCCESS: diskgroup ARCH was mounted
Archived Log entry 1831 added for thread 1 sequence 8 ID 0xddd7c8e4 dest 1:
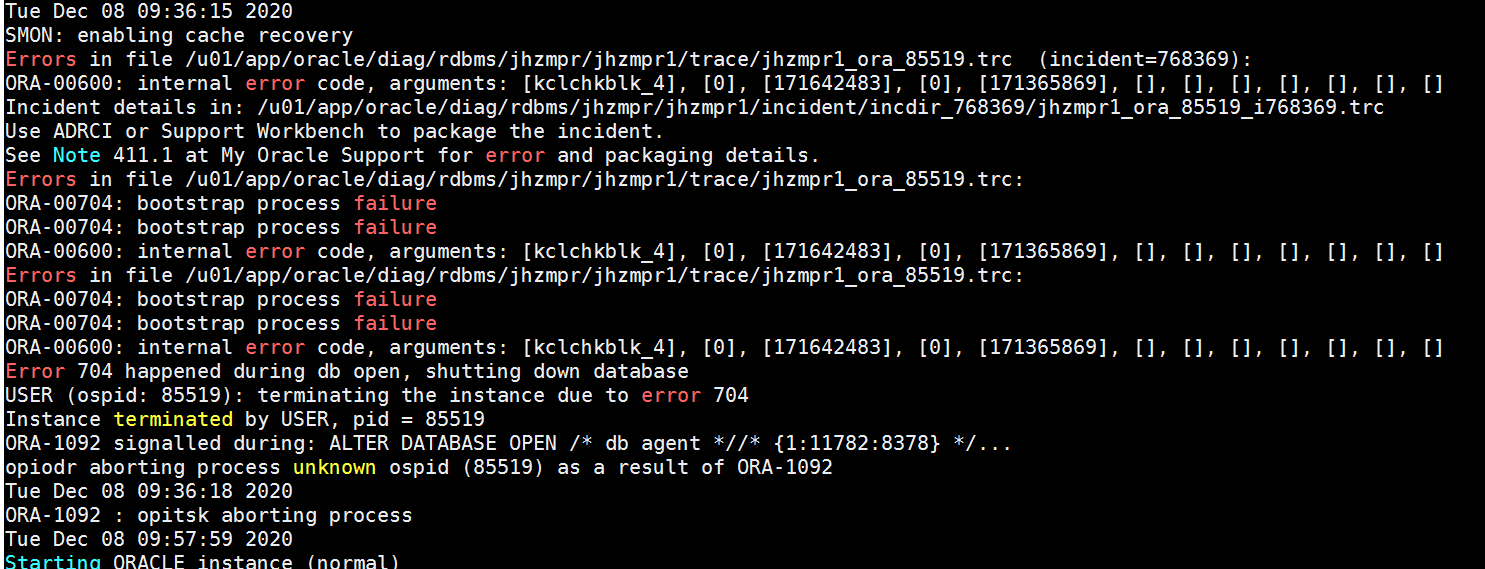
Errors in file /u01/app/oracle/diag/rdbms/jhzmpr/jhzmpr1/trace/jhzmpr1_ora_17070.trc  (incident=800345):
ORA-00600: internal error code, arguments: [kclchkblk_4], [0], [171642483], [0], [171385871], [], [], [], [], [], [], []
Incident details in: /u01/app/oracle/diag/rdbms/jhzmpr/jhzmpr1/incident/incdir_800345/jhzmpr1_ora_17070_i800345.trc
Use ADRCI or Support Workbench to package the incident.
See Note 411.1 at My Oracle Support for error and packaging details.
NOTE: dependency between database jhzmpr and diskgroup resource ora.ARCH.dg is established
Errors in file /u01/app/oracle/diag/rdbms/jhzmpr/jhzmpr1/trace/jhzmpr1_ora_17070.trc:
ORA-00704: bootstrap process failure
ORA-00600: internal error code, arguments: [kclchkblk_4], [0], [171642483], [0], [171385871], [], [], [], [], [], [], []
Errors in file /u01/app/oracle/diag/rdbms/jhzmpr/jhzmpr1/trace/jhzmpr1_ora_17070.trc:
ORA-00704: bootstrap process failure
ORA-00600: internal error code, arguments: [kclchkblk_4], [0], [171642483], [0], [171385871], [], [], [], [], [], [], []
Error 704 happened during db open, shutting down database
USER (ospid: 17070): terminating the instance due to error 704
Instance terminated by USER, pid = 17070
ORA-1092 signalled during: alter database open...
opiodr aborting process unknown ospid (17070) as a result of ORA-1092
Tue Dec 08 15:04:05 2020
ORA-1092 : opitsk aborting process

果不其然,argument d比上次推进了:从之前的171365869推进到171385871。同时,argument b保持不变,其它错误信息也保持一致。

2 继续上述操作

[root@jhzmpr01 ~]# srvctl start db -d jhzmpr
PRCR-1079 : Failed to start resource ora.jhzmpr.db
CRS-5017: The resource action "ora.jhzmpr.db start" encountered the following error:
ORA-01092: ORACLE instance terminated. Disconnection forced
ORA-00704: bootstrap process failure
ORA-00600: internal error code, arguments: [kclchkblk_4], [0], [171642483], [0], [171405876], [], [], [], [], [], [], []
Process ID: 21207
Session ID: 3175 Serial number: 3
. For details refer to "(:CLSN00107:)" in "/u01/app/11.2.0/grid/log/jhzmpr01/agent/crsd/oraagent_oracle//oraagent_oracle.log".

CRS-5017: The resource action "ora.jhzmpr.db start" encountered the following error:
ORA-01092: ORACLE instance terminated. Disconnection forced
ORA-00704: bootstrap process failure
ORA-00600: internal error code, arguments: [kclchkblk_4], [0], [171642483], [0], [171405882], [], [], [], [], [], [], []
Process ID: 43944
Session ID: 3175 Serial number: 3
. For details refer to "(:CLSN00107:)" in "/u01/app/11.2.0/grid/log/jhzmpr02/agent/crsd/oraagent_oracle//oraagent_oracle.log".

CRS-2674: Start of 'ora.jhzmpr.db' on 'jhzmpr01' failed
CRS-2674: Start of 'ora.jhzmpr.db' on 'jhzmpr02' failed
CRS-2632: There are no more servers to try to place resource 'ora.jhzmpr.db' on that would satisfy its placement policy
[root@jhzmpr01 ~]# 

3 直至错误参数一致

Tue Dec 08 15:44:31 2020
SMON: enabling cache recovery
SUCCESS: diskgroup ARCH was mounted
Archived Log entry 1846 added for thread 1 sequence 22 ID 0xddd7c8e4 dest 1:
NOTE: dependency between database jhzmpr and diskgroup resource ora.ARCH.dg is established
Errors in file /u01/app/oracle/diag/rdbms/jhzmpr/jhzmpr1/trace/jhzmpr1_ora_54315.trc  (incident=1248369):
ORA-00600: internal error code, arguments: [kclchkblk_4], [0], [171679465], [0], [171665974], [], [], [], [], [], [], []
Incident details in: /u01/app/oracle/diag/rdbms/jhzmpr/jhzmpr1/incident/incdir_1248369/jhzmpr1_ora_54315_i1248369.trc
Use ADRCI or Support Workbench to package the incident.
See Note 411.1 at My Oracle Support for error and packaging details.
Errors in file /u01/app/oracle/diag/rdbms/jhzmpr/jhzmpr1/trace/jhzmpr1_ora_54315.trc:
ORA-00600: internal error code, arguments: [kclchkblk_4], [0], [171679465], [0], [171665974], [], [], [], [], [], [], []
Errors in file /u01/app/oracle/diag/rdbms/jhzmpr/jhzmpr1/trace/jhzmpr1_ora_54315.trc:
ORA-00600: internal error code, arguments: [kclchkblk_4], [0], [171679465], [0], [171665974], [], [], [], [], [], [], []
Error 600 happened during db open, shutting down database
USER (ospid: 54315): terminating the instance due to error 600
Instance terminated by USER, pid = 54315
ORA-1092 signalled during: ALTER DATABASE OPEN /* db agent *//* {1:11782:10822} */...
opiodr aborting process unknown ospid (54315) as a result of ORA-1092
Tue Dec 08 15:44:34 2020
ORA-1092 : opitsk aborting process

4 启动数据库

Tue Dec 08 15:46:51 2020
Starting ORACLE instance (normal)
...
...
tarted redo scan
SUCCESS: diskgroup FLASH was mounted
Completed redo scan
 read 11 KB redo, 5 data blocks need recovery
Started redo application at
 Thread 1: logseq 23, block 3
Recovery of Online Redo Log: Thread 1 Group 5 Seq 23 Reading mem 0
  Mem# 0: +DATA/jhzmpr/onlinelog/group_5.273.1046776933
  Mem# 1: +FLASH/jhzmpr/onlinelog/group_5.256.1046776933
Completed redo application of 0.01MB
Completed crash recovery at
 Thread 1: logseq 23, block 25, scn 171685974
 5 data blocks read, 5 data blocks written, 11 redo k-bytes read
ARCH: STARTING ARCH PROCESSES
SMON: enabling tx recovery
*********************************************************************
WARNING: The following temporary tablespaces contain no files.
         This condition can occur when a backup controlfile has
         been restored.  It may be necessary to add files to these
         tablespaces.  That can be done using the SQL statement:

        ALTER TABLESPACE <tablespace_name> ADD TEMPFILE

        Alternatively, if these temporary tablespaces are no longer
        needed, then they can be dropped.
          Empty temporary tablespace: TEMP
*********************************************************************
Database Characterset is AL32UTF8
Errors in file /u01/app/oracle/diag/rdbms/jhzmpr/jhzmpr1/trace/jhzmpr1_smon_57089.trc  (incident=1280273):
ORA-00600: internal error code, arguments: [4194], [], [], [], [], [], [], [], [], [], [], []
Incident details in: /u01/app/oracle/diag/rdbms/jhzmpr/jhzmpr1/incident/incdir_1280273/jhzmpr1_smon_57089_i1280273.trc
Use ADRCI or Support Workbench to package the incident.
See Note 411.1 at My Oracle Support for error and packaging details.

5 至此,该错误已经消失了,数据库可以正常访问了。

但是,alert日志里抛出一个报警,让我们给数据库添加临时文件。为什么呢?这是因为,这位网友之前根据网上的一些帖子尝试对数据库删除临时文件,但是没能恢复数据库。这里,我们可以先不去理会临时文件的文件,可以让数据库使用SYSAUX那个表空间充当临时表空间,如果需要的话。

四 补充

1 SCN

①定义

System Change Number,数据库“内部时钟”,数据库中每时每刻都在发生改变,这些改变对应这一个具体的时间点儿,每个具体的时间点儿对应一个数字编号,这个编号就是SCN值。比如:2020年12月19日18时30分52秒,对应一个SCN号,35789713456。注意,不同时间点儿对应不同的SCN,数据库一旦启动运行,SCN就不停向前滚动。

② 作用

对于关系型数据库而言,用于事务的ACID控制和管理,以及数据库的备份和恢复的标准。

③位置

数据文件、控制文件、日志文件、数据文件头、数据块中都有记录。

④查看
SQL> select dbms_flashback.get_system_change_number scn from dual;

       SCN
----------
 112573590

SQL> select current_scn from v$database;

CURRENT_SCN
-----------
  112573593

SQL> select file#,CHECKPOINT_CHANGE#,CHECKPOINT_TIME from v$datafile;

     FILE# CHECKPOINT_CHANGE# CHECKPOINT_TIME
---------- ------------------ -------------------
         1          112563728 2020/12/19 15:38:19
         2          112563728 2020/12/19 15:38:19
         3          112563728 2020/12/19 15:38:19
         4          112563728 2020/12/19 15:38:19
         5          112563728 2020/12/19 15:38:19
         6          112563728 2020/12/19 15:38:19
         7          112563728 2020/12/19 15:38:19

7 rows selected.

SQL> select group#,FIRST_CHANGE#,FIRST_TIME from v$log;

    GROUP# FIRST_CHANGE# FIRST_TIME
---------- ------------- -------------------
         1     112563728 2020/12/19 15:38:19
         2     112544279 2020/12/19 11:35:21
         3     112551742 2020/12/19 12:37:46

SQL> 
⑤结构和计数原理

占6个字节,48个二进制位数。前2个字节构成SCN_WRAP,最大值为2的16次方,65536。后4个字节构成SCN_BASE,最大值为2的32次方,4294967296。SCN总大小为2的48次方=281474976710656,281万亿个计数。

假定初始情况下,SCN_WRAP=0,SCN_BASE从1开始计数,当达到最大值4294967296时,就向前进一位,SCN_WRAP从0变为1,同时SCN_BASE从0重新开始计数,下一次达到最大值时,再向前进一位,SCN_WRAP再加1,SCN_BASE再次从0重新开始计数,以此循环往复。直至SCN用完耗尽为止。

SCN = (SCN_WRAP * 4294967296) + SCN_BASE

举个生活中的例子,类似于我们的计时秒表,当秒针从0跳到59时,分针从0变为1,同时秒针重新从0开始,直到到达下一个59秒,分针从1跳到2….

Oracle为什么要这么设计呢?这很好理解,例如,我们日常生活中会说3分28秒,很少有人直接说208秒,对不对? 就图一方便计数呗。

从Oracle12.2开始,SCN改为8个字节了,所以,其总大小变为2的63次方了。一个更大的数了。

2 Checkpoint

A checkpoint is the act of flushing modified, cached database blocks to disk. Normally, when you make a change to a block the modifications of that block are made to a memory copy of the block. When you commit the block, it is not written to the datafile but it is written to the REDO LOG, so we can “replay” a transaction in the event of an instance failure. Eventually, the system will checkpoint your modified blocks to the datafiles on disk.

  • When all dirty buffers in the Oracle SGA are written to datafiles by DBWR.

  • When a redo log switch occurs.

  • Whenever the time set by the LOG_CHECKPOINT_TIMEOUT parameter is reached.

  • By issuing the command ‘alter system switch logfile’ or ‘alter system checkpoint’.

说一个简单的场景,假定我们要执行下述SQL,修改表里的一条记录:

update department set emp_name=’Huangwei’ where emp_name=’huangwei’;


update department set emp_name='Huangwei' where emp_name='huangwei';

数据库肯定不会直接到磁盘中去修改该数据,因为如果把数据读入到内存中,在内存中读写数据,比读写磁盘要快不止一个数量级。所以,

① 数据库先到内存中去找要修改的数据,如果内存中没有该数据的话,Oracle数据库的服务器进程把需要的数据从磁盘中读取到内存中;注意,Oracle不会只读这一条记录的数据,而是读取该记录所在的数据块,把整个数据块的内容全部读入内存。为了性能和效率,Oracle数据库肯定不会傻傻的一次只读一条记录的数据,最小IO单位是database block,其它关系型数据库也类似。

② 然后准备在内存中对该数据进行修改;真正修改之前,还要先做另外一件事儿:就是把这份数据放到一个undo回滚段中,用于确保事务的一致性读或者回滚等操作。接下来,给该SQL语句分配一个事务号,说白了就是一个SCN号。并开始执行真正的修改,同时,在redo log buffer里对该操作进行完整的记录(如:2020年12月19日19点40分,这个时间点儿其实就是这个个SCN,将‘huangwei’修改成了‘Huangwei’),为什么要记录这个呢?答案是便于恢复数据,这里就不再继续扩展。注意,该修改过的新数据(称为dirty buffer)并不一定马上写回到磁盘中;

③ 当我们执行commit时,这时,该修改过的新数据(称为dirty buffer)写回到磁盘中去了吗???

④ 也不一定,因为,此时只要保证redo log buffer里,记录的关于本条SQL修改的信息被LGWR后台进程写出到redo log file里,就算完成了。在不考虑数据库包含DATAGUARD备库的情况下,此时就可以立即返回commit成功,即告诉你,你的修改已经生效了。为什么呢?这就是Oracle的redo log file的作用,如果此时数据库出现instance crash的话,我的修改还在吗?在,Oracle可以利用写入到redo logfile里的内容,进行“redo”,或者叫“replay”。这也就是它为啥叫redo了。

⑤那问题来了?到底什么时候,我的这个修改被真正写回到磁盘中呢?答案,看情况。

比如:如果此时,数据库的database buffer cache不够用了,数据库会根据LRU算法把旧的脏数据写出到磁盘中;

或者:此时发生了redo logfile switch;

再:手工执行了 alter system checkpoint;等。

注意,把内存中的脏数据写出到数据文件是DBWR后台进程干的活儿;记录检查点信息到控制文件、同步到数据文件、日志文件中,则是CKPT后台进程的职责。

The checkpoint process updates the control file when a checkpoint is performed. Remember that a checkpoint operation writes all changed (dirty) blocks to disk. By recording this fact in the control file, Oracle knows what redo records need to be applied in the event of an instance failure. To recover from an instance failure, Oracle needs to apply all redo generated after the last checkpoint recorded in the control file.

  • Log switches cause checkpoints. Checkpoints do not cause log switches.

  • DBWR writes dirty blocks from the buffer cache to disk — that does not happen when you “commit” — LGWR is involved during a commit.

五 小结

1 解决该数据库故障并不难

只是需要不停的startup,shudown,再startup。难点在于去分析和定位该问题,找到一些相关的线索,并支撑和问题相关的错误信息。

2 如何规避该问题

如果这位网友的数据库,在故障发生之前,执行了合适的热备份+归档的话,遇到该故障的时候,可能就没有这么被动。

3 备份很重要

在遇到数据库故障或者错误的场景下,一定要尽可能的先对数据库进行备份,保留数据库故障现场,便于后续恢复不成功的情况下,可以多次重新尝试。另外,如果的确没有十足把握的话,不要轻易尝试对数据库执行各种恢复操作。总结该故障的过程中,发现系统报错时间:

Sun Dec 06 05:16:31 2020
Thread 1 advanced to log sequence 652 (LGWR switch)
  Current log# 2 seq# 652 mem# 0: +DATA/jhzmpr/onlinelog/group_2.264.1045198071
  Current log# 2 seq# 652 mem# 1: +DATA/jhzmpr/onlinelog/group_2.265.1045198073
Sun Dec 06 05:16:33 2020
Archived Log entry 1816 added for thread 1 sequence 651 ID 0xdd0af974 dest 1:
Sun Dec 06 05:45:39 2020
WARNING: Write Failed. group:2 disk:2 AU:54678 offset:49152 size:8192
Errors in file /u01/app/oracle/diag/rdbms/jhzmpr/jhzmpr1/trace/jhzmpr1_dbwb_7076.trc:
ORA-15080: synchronous I/O operation to a disk failed
ORA-27061: waiting for async I/Os failed
Linux-x86_64 Error: 5: Input/output error
Additional information: -1
Additional information: 8192
WARNING: failed to write mirror side 1 of virtual extent 7778 logical extent 0 of file 315 in group 2 on disk 2 allocation unit 54678
KCF: read, write or open error, block=0xf3106 online=1
file=10 '+DATA/jhzmpr/datafile/aoi.315.1057790147'
error=15081 txt: ''
Errors in file /u01/app/oracle/diag/rdbms/jhzmpr/jhzmpr1/trace/jhzmpr1_dbwb_7076.trc:
Sun Dec 06 05:45:39 2020
WARNING: Read Failed. group:2 disk:0 AU:340 offset:49152 size:16384
WARNING: failed to read mirror side 1 of virtual extent 4 logical extent 0 of file 261 in group [2.4004072768] from disk DATA_0000  allocation unit 340 reason error; if possible, will try another mirror side
Sun Dec 06 05:45:39 2020
...
...
Sun Dec 06 05:45:46 2020
License high water mark = 102
Termination issued to instance processes. Waiting for the processes to exit
Sun Dec 06 05:46:00 2020
Instance termination failed to kill one or more processes
Instance terminated by CKPT, pid = 7080
Sun Dec 06 05:46:00 2020
第一次手工尝试恢复故障:
Sun Dec 06 14:28:32 2020
Starting ORACLE instance (normal)
...
Errors in file /u01/app/oracle/diag/rdbms/jhzmpr/jhzmpr1/trace/jhzmpr1_ora_6706.trc:
ORA-00742: Log read detects lost write in thread %d sequence %d block %d
ORA-00312: online log 2 thread 1: '+DATA/jhzmpr/onlinelog/group_2.265.1045198073'
ORA-00312: online log 2 thread 1: '+DATA/jhzmpr/onlinelog/group_2.264.1045198071'
ORA-742 signalled during: ALTER DATABASE OPEN /* db agent *//* {1:11782:2} */...
Sun Dec 06 14:28:57 2020
Shutting down instance (abort)

第二次
Sun Dec 06 23:37:03 2020
Starting ORACLE instance (normal)
...
Mon Dec 07 00:27:06 2020
alter database clear unarchived logfile group 2
ORA-1624 signalled during: alter database clear unarchived logfile group 2...
Mon Dec 07 00:28:08 2020
ALTER DATABASE RECOVER  database using backup controlfile until cancel  
Media Recovery Start
 started logmerger process
Mon Dec 07 00:28:08 2020

...
Mon Dec 07 00:29:27 2020
Errors in file /u01/app/oracle/diag/rdbms/jhzmpr/jhzmpr1/trace/jhzmpr1_pr00_43688.trc:
ORA-01547: warning: RECOVER succeeded but OPEN RESETLOGS would get error below
ORA-01194: file 1 needs more recovery to be consistent
ORA-01110: data file 1: '+DATA/jhzmpr/datafile/system.256.1045198003'
ORA-1547 signalled during: ALTER DATABASE RECOVER    CANCEL  ...
ALTER DATABASE RECOVER CANCEL 
ORA-1112 signalled during: ALTER DATABASE RECOVER CANCEL ...
Mon Dec 07 00:29:41 2020
alter database open resetlogs
ORA-1194 signalled during: alter database open resetlogs...
Mon Dec 07 00:30:17 2020
ALTER DATABASE RECOVER  database using backup controlfile until cancel allow 1 corruption  
Media Recovery Start
Serial Media Recovery started
...
Mon Dec 07 22:28:46 2020
SMON: enabling cache recovery
Instance recovery: looking for dead threads
Instance recovery: lock domain invalid but no dead threads
Errors in file /u01/app/oracle/diag/rdbms/jhzmpr/jhzmpr1/trace/jhzmpr1_ora_39995.trc  (incident=576369):
ORA-00600: internal error code, arguments: [kclchkblk_4], [0], [171642483], [0], [171225822], [], [], [], [], [], [], []
Incident details in: /u01/app/oracle/diag/rdbms/jhzmpr/jhzmpr1/incident/incdir_576369/jhzmpr1_ora_39995_i576369.trc
Use ADRCI or Support Workbench to package the incident.

4 祸不单行,福无双降,顺手帮忙

这个库处理好之后,那哥们儿出于对我的信任,又请我帮忙处理同样跑在该存储设备上另外几个同样没能幸免于难的数据库故障。那些使用该存储设备作为数据库存储的好几个数据库都挂了,

5 参考链接

https://topic.alibabacloud.com/a/ora-00600-kclchkblk_4-error-recovery-method-introduction-12_8_8_20042453.html

http://blog.itpub.net/29863023/viewspace-2132815/


6 感谢

各位老铁,如果觉得我的视频内容有用,能帮助到你,请帮忙一键三连,顺手转发给更多的朋友。

访问我的个人站点,查看本视频中提到的所有文档和资料素材: http://oracleonlinux.cn/

感谢大家的收看,我们下一期视频节目再见。

最后,欢迎大家关注我的个人微信公众号。


PostgreSQL数据库SQL优化案例:从2秒到2毫秒

零 背景说明

这是生产环境下,一则PostgreSQL数据库SQL优化的案例小结:单条SQL执行时间,从优化前2秒到优化后,降低到2毫秒,性能提升1000倍。数据库版本为PostgreSQL 9.3。原始SQL语句如下:

SELECT t.id,
       t.code,
       t.name,
       t.level,
       t.IS_CLOSED isClosed,
       t.PARENT_ID parentId,
       t.dir,
       t.remark
FROM t_report_type t
WHERE 1=1
  AND t.code IN
    (SELECT report_type
     FROM t_report_temp
     WHERE corp_id IS NULL
       AND partner_id IS NULL)
ORDER BY t.code

优化前执行计划如下:

EXPLAIN ANALYZE
SELECT t.id,
       t.code,
       t.name,
       t.level,
       t.IS_CLOSED isClosed,
       t.PARENT_ID parentId,
       t.dir,
       t.remark
FROM t_report_type t
WHERE 1=1
  AND t.code IN
    (SELECT report_type
     FROM t_report_temp
     WHERE corp_id IS NULL
       AND partner_id IS NULL)
ORDER BY t.code

┌────────────────────────────────────────────────────────────────────────────────────────────────────────────────────────────────────────────────────────┐
│                                                                       QUERY PLAN                                                                       │
├────────────────────────────────────────────────────────────────────────────────────────────────────────────────────────────────────────────────────────┤
│ Sort  (cost=3179.42..3179.93 rows=204 width=165) (actual time=2179.224..2179.250 rows=383 loops=1)                                                     │
│   Sort Key: t.code                                                                                                                                     │
│   Sort Method: quicksort  Memory: 126kB                                                                                                                │
│   ->  Nested Loop Semi Join  (cost=0.55..3171.59 rows=204 width=165) (actual time=26.092..2178.526 rows=383 loops=1)                                   │
│         ->  Seq Scan on t_report_type t  (cost=0.00..16.59 rows=459 width=165) (actual time=0.002..0.187 rows=459 loops=1)                             │
│         ->  Index Only Scan using t_report_temp_01 on t_report_temp  (cost=0.55..1873.80 rows=428 width=7) (actual time=4.744..4.744 rows=1 loops=459) │
│               Index Cond: ((corp_id IS NULL) AND (partner_id IS NULL) AND (report_type = (t.code)::text))                                              │
│               Heap Fetches: 53                                                                                                                         │
│ Total runtime: 2179.301 ms                                                                                                                             │
└────────────────────────────────────────────────────────────────────────────────────────────────────────────────────────────────────────────────────────┘
(9 rows)

一 分析问题

结合执行来分析SQL语句,查看表结构,数据量分布:

zyd=> \d t_report_type
                 Table "zyd.t_report_type"
┌───────────┬────────────────────────┬─────────────────────┐
│  Column   │          Type          │      Modifiers      │
├───────────┼────────────────────────┼─────────────────────┤
│ id        │ character(32)          │ not null            │
│ code      │ character varying(32)  │ not null            │
│ name      │ character varying(256) │ not null            │
│ parent_id │ character varying(32)  │                     │
│ dir       │ character varying(256) │                     │
│ level     │ smallint               │                     │
│ is_closed │ character(1)           │ default '0'::bpchar │
│ remark    │ character varying(200) │                     │
└───────────┴────────────────────────┴─────────────────────┘
Indexes:
    "t_report_type_pkey" PRIMARY KEY, btree (id)
    "t_report_type_01" btree (code, parent_id, dir)

zyd=> select count(*) from t_report_type;
┌───────┐
│ count │
├───────┤
│   459 │
└───────┘
(1 row)

zyd=> select count(*) from t_report_temp;
┌────────┐
│ count  │
├────────┤
│ 366132 │
└────────┘
(1 row)

zyd=> \d t_report_temp
                 Table "zyd.t_report_temp"
┌─────────────┬────────────────────────────────┬───────────┐
│   Column    │              Type              │ Modifiers │
├─────────────┼────────────────────────────────┼───────────┤
│ id          │ character(32)                  │ not null  │
│ report_code │ character varying(40)          │ not null  │
│ report_name │ character varying(100)         │ not null  │
│ report_type │ character varying(32)          │ not null  │
│ corp_id     │ character(32)                  │           │
│ partner_id  │ character(32)                  │           │
│ industry_id │ character(32)                  │           │
│ is_default  │ character(1)                   │           │
│ remark      │ character varying(200)         │           │
│ source_type │ character varying(255)         │           │
│ is_show     │ character(1)                   │ default 0 │
│ create_ts   │ timestamp(6) without time zone │           │
│ update_ts   │ timestamp(6) without time zone │           │
│ is_simple   │ character(1)                   │           │
└─────────────┴────────────────────────────────┴───────────┘
Indexes:
    "t_report_temp_pkey" PRIMARY KEY, btree (id)
    "t_report_temp_01" btree (corp_id, industry_id, partner_id, report_code, report_type, report_name)
    "t_report_temp_02" btree (industry_id, partner_id, report_type)
    "t_report_temp_03" btree (industry_id, report_type)
    "t_report_temp_04" btree (report_name, corp_id, report_code)
    "t_report_temp_index_1" btree (corp_id, report_code)

zyd=> select count(*) from t_report_temp where corp_id is null and partner_id is null;
┌───────┐
│ count │
├───────┤
│  1126 │
└───────┘
(1 row)

zyd=>

看到,这是一个简单的2张表做join连接的SQL查询语句,优化器选择了嵌套循环nested loop的关联方式,其中一张表t_report_type为小表,数据量为459,优化器选择全表扫描的方式获取数据,另外一张表t_report_temp数据量相对多一些,366132条数据,但是满足条件的数据却只有1126条,同时选择了index only scan的方式,单次执行耗时4.744毫秒。

这是从执行计划看到的基本信息,能优化的突破口基本也就是对于表的访问能不能更快?虽然这里选择的是index only scan的方式。

三 解决问题

先尝试重新收集表的统计信息,再查看其执行计划是否有好转?

zyd=> analyze verbose t_report_temp;
INFO:  analyzing "zyd.t_report_temp"
INFO:  "t_report_temp": scanned 9494 of 9494 pages, containing 366132 live rows and 1345 dead rows; 30000 rows in sample, 366132 estimated total rows
ANALYZE
zyd=> analyze verbose t_report_type;
INFO:  analyzing "zyd.t_report_type"
INFO:  "t_report_type": scanned 12 of 12 pages, containing 459 live rows and 0 dead rows; 459 rows in sample, 459 estimated total rows
ANALYZE
zyd=>
...查看执行计划
...
┌────────────────────────────────────────────────────────────────────────────────────────────────────────────────────────────────────────────────────────┐
│                                                                       QUERY PLAN                                                                       │
├────────────────────────────────────────────────────────────────────────────────────────────────────────────────────────────────────────────────────────┤
│ Sort  (cost=3179.42..3179.93 rows=204 width=165) (actual time=1973.808..1973.836 rows=383 loops=1)                                                     │
│   Sort Key: t.code                                                                                                                                     │
│   Sort Method: quicksort  Memory: 126kB                                                                                                                │
│   ->  Nested Loop Semi Join  (cost=0.55..3171.59 rows=204 width=165) (actual time=29.583..1973.127 rows=383 loops=1)                                   │
│         ->  Seq Scan on t_report_type t  (cost=0.00..16.59 rows=459 width=165) (actual time=0.002..0.175 rows=459 loops=1)                             │
│         ->  Index Only Scan using t_report_temp_01 on t_report_temp  (cost=0.55..1873.80 rows=428 width=7) (actual time=4.297..4.297 rows=1 loops=459) │
│               Index Cond: ((corp_id IS NULL) AND (partner_id IS NULL) AND (report_type = (t.code)::text))                                              │
│               Heap Fetches: 53                                                                                                                         │
│ Total runtime: 1973.885 ms                                                                                                                             │
└────────────────────────────────────────────────────────────────────────────────────────────────────────────────────────────────────────────────────────┘
(9 rows)

zyd=>

发现,并没有好转。观察到其执行计划中,对于相对大的那个表t_report_temp,优化器选择了通过t_report_temp_01这个index来做的index only scan,每次耗时4毫秒左右,但是loops=459,累积起来就1800多毫秒了。

同时,该indext_report_temp_01是一个联合index,基于(corp_id, industry_id, partner_id, report_code, report_type, report_name) 6个字段创建的联合index,观察表和该index的大小:

zyd=> \dt+ t_report_temp
                        List of relations
┌────────┬───────────────┬───────┬───────┬───────┬──────────────┐
│ Schema │     Name      │ Type  │ Owner │ Size  │ Description  │
├────────┼───────────────┼───────┼───────┼───────┼──────────────┤
│ zyd    │ t_report_temp │ table │ zyd   │ 74 MB │ 报表模板主表 │
└────────┴───────────────┴───────┴───────┴───────┴──────────────┘
(1 row)

zyd=> \di+ t_report_temp_01
                                 List of relations
┌────────┬──────────────────┬───────┬───────┬───────────────┬───────┬─────────────┐
│ Schema │       Name       │ Type  │ Owner │     Table     │ Size  │ Description │
├────────┼──────────────────┼───────┼───────┼───────────────┼───────┼─────────────┤
│ zyd    │ t_report_temp_01 │ index │ zyd   │ t_report_temp │ 80 MB │             │
└────────┴──────────────────┴───────┴───────┴───────────────┴───────┴─────────────┘
(1 row)

zyd=>

发现,这个index 80MB,比表本身74MB还大。是不是推断出,此种情况下,优化器选择通过该index来获取数据不够好呢,或者说还不如直接扫描这个表呢?

开始验证:

zyd=> set enable_indexscan =off;
SET
zyd=> set enable_indexonlyscan =off;
SET
zyd=> set enable_bitmapscan =off;
SET
zyd=> explain analyze..
..
..
┌─────────────────────────────────────────────────────────────────────────────────────────────────────────────────────────────────────┐
│                                                             QUERY PLAN                                                              │
├─────────────────────────────────────────────────────────────────────────────────────────────────────────────────────────────────────┤
│ Merge Join  (cost=13420.55..13423.58 rows=204 width=165) (actual time=69.095..69.417 rows=383 loops=1)                              │
│   Merge Cond: ((t.code)::text = (t_report_temp.report_type)::text)                                                                  │
│   ->  Sort  (cost=36.88..38.03 rows=459 width=165) (actual time=0.513..0.569 rows=459 loops=1)                                      │
│         Sort Key: t.code                                                                                                            │
│         Sort Method: quicksort  Memory: 145kB                                                                                       │
│         ->  Seq Scan on t_report_type t  (cost=0.00..16.59 rows=459 width=165) (actual time=0.002..0.121 rows=459 loops=1)          │
│   ->  Sort  (cost=13383.67..13383.79 rows=49 width=7) (actual time=68.576..68.600 rows=383 loops=1)                                 │
│         Sort Key: t_report_temp.report_type                                                                                         │
│         Sort Method: quicksort  Memory: 42kB                                                                                        │
│         ->  HashAggregate  (cost=13381.80..13382.29 rows=49 width=7) (actual time=68.253..68.309 rows=383 loops=1)                  │
│               ->  Seq Scan on t_report_temp  (cost=0.00..13163.63 rows=87269 width=7) (actual time=0.005..67.787 rows=1126 loops=1) │
│                     Filter: ((corp_id IS NULL) AND (partner_id IS NULL))                                                            │
│                     Rows Removed by Filter: 365114                                                                                  │
│ Total runtime: 69.480 ms                                                                                                            │
└─────────────────────────────────────────────────────────────────────────────────────────────────────────────────────────────────────┘
(14 rows)

zyd=> 

此时,可以看到,当我们禁用index only scan,index scan,bitmap index scan之后,使优化器对于表t_report_temp选择全表扫描之后,整个SQL的执行效率反而更好。
于是,尝试在(report_type,corp_id,partner_id)创建联合index,观察一下SQL效率:

zyd=> create index CONCURRENTLY idx_3 on t_report_temp(report_type,corp_id,partner_id);
CREATE INDEX
zyd=> explain analyze ....
..
┌───────────────────────────────────────────────────────────────────────────────────────────────────────────────────────────────────────────┐
│                                                                QUERY PLAN                                                                 │
├───────────────────────────────────────────────────────────────────────────────────────────────────────────────────────────────────────────┤
│ Sort  (cost=267.54..268.05 rows=204 width=165) (actual time=2.525..2.554 rows=383 loops=1)                                                │
│   Sort Key: t.code                                                                                                                        │
│   Sort Method: quicksort  Memory: 126kB                                                                                                   │
│   ->  Nested Loop Semi Join  (cost=0.42..259.72 rows=204 width=165) (actual time=0.041..2.083 rows=383 loops=1)                           │
│         ->  Seq Scan on t_report_type t  (cost=0.00..16.59 rows=459 width=165) (actual time=0.002..0.053 rows=459 loops=1)                │
│         ->  Index Only Scan using idx_3 on t_report_temp  (cost=0.42..29.58 rows=428 width=7) (actual time=0.004..0.004 rows=1 loops=459) │
│               Index Cond: ((report_type = (t.code)::text) AND (corp_id IS NULL) AND (partner_id IS NULL))                                 │
│               Heap Fetches: 27                                                                                                            │
│ Total runtime: 2.600 ms                                                                                                                   │
└───────────────────────────────────────────────────────────────────────────────────────────────────────────────────────────────────────────┘
(9 rows)

zyd=>

发现,此时SQL的执行耗时从之前的2秒降低到2.6毫秒。

四 小结

通过深入分析SQL执行计划、结合表结构、数据量及数据分布,是做好SQL优化的基本出发点。需要更为深入学习和分析SQL执行计划,能看懂SQL执行计划,对SQL执行计划有感觉,多看多读执行计划,多思考。

PostgreSQL官方文档中,关于执行计划描述,有这么一句话:

Plan-reading is an art that requires some experience to master, but this section attempts to cover the basics.

wordpress迁移步骤和遇到的问题及解决

零 背景说明:

我的这个站点目前托管在香港,采用的是LAMP,即Linux+Apache+MySQL+PHP架构。将于2018年9月6日到期。在到期之前,研究了一下,如果需要迁移到新主机的话,大致流程和步骤,这里简单总结一下。

即,模拟将现有的oracleonlinux.cn(LAMP架构)迁移至本地机器,并且启用新的blog.com域名(这个域名是虚拟的,通过NGINX模拟反向解析,然后配置本地hosts文件)采用LNMP架构。把之前的Apache换成NGINX,域名也更换一下。

一 备份站点文件

即备份主机上的Wordpress及其全部子目录即可,可以采用Linux系统的tar命令来打包。我这里,由于主机服务商暂时不提供SSH远程访问权限,无法连到主机上直接执行备份,但是有Cpanel控制台,我是通过Cpanel控制台上选择的全部备份,然后将备份文件下载到本地:

[root@localhost ~]# ll backup-9.3.2018_08-30-42_oracleon.tar.gz 
-rw-r--r-- 1 nginx nginx 260642919 9月   3 21:06 backup-9.3.2018_08-30-42_oracleon.tar.gz
[root@localhost ~]#

二 备份MySQL数据库

同样,通过Cpanel控制台上选择备份数据库,然后下载到本地:

[root@localhost ~]# ll oracleon_oracle.sql.gz 
-rw-r--r--. 1 root root 3155154 9月   3 19:53 oracleon_oracle.sql.gz
[root@localhost ~]#

三 本地搭建LNMP环境

Linux:Centos 6.5,本地IP为172.16.11.80:

[root@localhost ~]# cat /etc/redhat-release 
CentOS release 6.5 (Final)
[root@localhost ~]# uname -rm
2.6.32-431.el6.x86_64 x86_64
[root@localhost ~]# ifconfig 
eth0      Link encap:Ethernet  HWaddr 00:50:56:99:3D:E7  
          inet addr:172.16.11.80  Bcast:172.16.11.255  Mask:255.255.255.0
          inet6 addr: fe80::250:56ff:fe99:3de7/64 Scope:Link
          UP BROADCAST RUNNING MULTICAST  MTU:1500  Metric:1
          RX packets:2903715683 errors:0 dropped:0 overruns:0 frame:0
          TX packets:3509490556 errors:0 dropped:0 overruns:0 carrier:0
          collisions:0 txqueuelen:1000 
          RX bytes:1030640015360 (959.8 GiB)  TX bytes:3030630388115 (2.7 TiB)

lo        Link encap:Local Loopback  
          inet addr:127.0.0.1  Mask:255.0.0.0
          inet6 addr: ::1/128 Scope:Host
          UP LOOPBACK RUNNING  MTU:16436  Metric:1
          RX packets:414816117 errors:0 dropped:0 overruns:0 frame:0
          TX packets:414816117 errors:0 dropped:0 overruns:0 carrier:0
          collisions:0 txqueuelen:0 
          RX bytes:469426552437 (437.1 GiB)  TX bytes:469426552437 (437.1 GiB)

[root@localhost ~]#

NGINX:直接通过yum安装;

[root@localhost ~]# yum install nginx
已加载插件:fastestmirror
设置安装进程
Loading mirror speeds from cached hostfile
 * base: mirrors.163.com
 * epel: mirrors.ustc.edu.cn
 * extras: mirrors.shu.edu.cn
 * updates: mirrors.zju.edu.cn
解决依赖关系
--> 执行事务检查
---> Package nginx.x86_64 0:1.10.2-1.el6 will be 安装
--> 处理依赖关系 nginx-filesystem = 1.10.2-1.el6,它被软件包 nginx-1.10.2-1.el6.x86_64 需要
--> 处理依赖关系 nginx-all-modules = 1.10.2-1.el6,它被软件包 nginx-1.10.2-1.el6.x86_64 需要
--> 处理依赖关系 nginx-filesystem,它被软件包 nginx-1.10.2-1.el6.x86_64 需要
--> 执行事务检查
---> Package nginx-all-modules.noarch 0:1.10.2-1.el6 will be 安装
--> 处理依赖关系 nginx-mod-stream = 1.10.2-1.el6,它被软件包 nginx-all-modules-1.10.2-1.el6.noarch 需要
--> 处理依赖关系 nginx-mod-mail = 1.10.2-1.el6,它被软件包 nginx-all-modules-1.10.2-1.el6.noarch 需要
--> 处理依赖关系 nginx-mod-http-xslt-filter = 1.10.2-1.el6,它被软件包 nginx-all-modules-1.10.2-1.el6.noarch 需要
--> 处理依赖关系 nginx-mod-http-perl = 1.10.2-1.el6,它被软件包 nginx-all-modules-1.10.2-1.el6.noarch 需要
--> 处理依赖关系 nginx-mod-http-image-filter = 1.10.2-1.el6,它被软件包 nginx-all-modules-1.10.2-1.el6.noarch 需要
--> 处理依赖关系 nginx-mod-http-geoip = 1.10.2-1.el6,它被软件包 nginx-all-modules-1.10.2-1.el6.noarch 需要
---> Package nginx-filesystem.noarch 0:1.10.2-1.el6 will be 安装
--> 执行事务检查
---> Package nginx-mod-http-geoip.x86_64 0:1.10.2-1.el6 will be 安装
---> Package nginx-mod-http-image-filter.x86_64 0:1.10.2-1.el6 will be 安装
---> Package nginx-mod-http-perl.x86_64 0:1.10.2-1.el6 will be 安装
---> Package nginx-mod-http-xslt-filter.x86_64 0:1.10.2-1.el6 will be 安装
---> Package nginx-mod-mail.x86_64 0:1.10.2-1.el6 will be 安装
---> Package nginx-mod-stream.x86_64 0:1.10.2-1.el6 will be 安装
--> 完成依赖关系计算

依赖关系解决

=================================================================================================================================
 软件包                                       架构                    版本                           仓库                   大小
=================================================================================================================================
正在安装:
 nginx                                        x86_64                  1.10.2-1.el6                   epel                  462 k
为依赖而安装:
 nginx-all-modules                            noarch                  1.10.2-1.el6                   epel                  7.7 k
 nginx-filesystem                             noarch                  1.10.2-1.el6                   epel                  8.5 k
 nginx-mod-http-geoip                         x86_64                  1.10.2-1.el6                   epel                   14 k
 nginx-mod-http-image-filter                  x86_64                  1.10.2-1.el6                   epel                   16 k
 nginx-mod-http-perl                          x86_64                  1.10.2-1.el6                   epel                   26 k
 nginx-mod-http-xslt-filter                   x86_64                  1.10.2-1.el6                   epel                   16 k
 nginx-mod-mail                               x86_64                  1.10.2-1.el6                   epel                   43 k
 nginx-mod-stream                             x86_64                  1.10.2-1.el6                   epel                   36 k

事务概要
=================================================================================================================================
Install       9 Package(s)

总下载量:629 k
Installed size: 1.6 M
确定吗?[y/N]:y
下载软件包:
(1/9): nginx-1.10.2-1.el6.x86_64.rpm                                                                      | 462 kB     00:00     
(2/9): nginx-all-modules-1.10.2-1.el6.noarch.rpm                                                          | 7.7 kB     00:00     
(3/9): nginx-filesystem-1.10.2-1.el6.noarch.rpm                                                           | 8.5 kB     00:00     
(4/9): nginx-mod-http-geoip-1.10.2-1.el6.x86_64.rpm                                                       |  14 kB     00:00     
(5/9): nginx-mod-http-image-filter-1.10.2-1.el6.x86_64.rpm                                                |  16 kB     00:00     
(6/9): nginx-mod-http-perl-1.10.2-1.el6.x86_64.rpm                                                        |  26 kB     00:00     
(7/9): nginx-mod-http-xslt-filter-1.10.2-1.el6.x86_64.rpm                                                 |  16 kB     00:00     
(8/9): nginx-mod-mail-1.10.2-1.el6.x86_64.rpm                                                             |  43 kB     00:00     
(9/9): nginx-mod-stream-1.10.2-1.el6.x86_64.rpm                                                           |  36 kB     00:00     
---------------------------------------------------------------------------------------------------------------------------------
总计                                                                                             719 kB/s | 629 kB     00:00     
运行 rpm_check_debug 
执行事务测试
事务测试成功
执行事务
  正在安装   : nginx-filesystem-1.10.2-1.el6.noarch                                                                          1/9 
  正在安装   : nginx-mod-http-geoip-1.10.2-1.el6.x86_64                                                                      2/9 
  正在安装   : nginx-mod-stream-1.10.2-1.el6.x86_64                                                                          3/9 
  正在安装   : nginx-mod-http-perl-1.10.2-1.el6.x86_64                                                                       4/9 
  正在安装   : nginx-mod-http-image-filter-1.10.2-1.el6.x86_64                                                               5/9 
  正在安装   : nginx-mod-http-xslt-filter-1.10.2-1.el6.x86_64                                                                6/9 
  正在安装   : nginx-1.10.2-1.el6.x86_64                                                                                     7/9 
  正在安装   : nginx-mod-mail-1.10.2-1.el6.x86_64                                                                            8/9 
  正在安装   : nginx-all-modules-1.10.2-1.el6.noarch                                                                         9/9 
  Verifying  : nginx-mod-mail-1.10.2-1.el6.x86_64                                                                            1/9 
  Verifying  : nginx-mod-http-geoip-1.10.2-1.el6.x86_64                                                                      2/9 
  Verifying  : nginx-mod-stream-1.10.2-1.el6.x86_64                                                                          3/9 
  Verifying  : nginx-all-modules-1.10.2-1.el6.noarch                                                                         4/9 
  Verifying  : nginx-mod-http-perl-1.10.2-1.el6.x86_64                                                                       5/9 
  Verifying  : nginx-mod-http-image-filter-1.10.2-1.el6.x86_64                                                               6/9 
  Verifying  : nginx-1.10.2-1.el6.x86_64                                                                                     7/9 
  Verifying  : nginx-filesystem-1.10.2-1.el6.noarch                                                                          8/9 
  Verifying  : nginx-mod-http-xslt-filter-1.10.2-1.el6.x86_64                                                                9/9 

已安装:
  nginx.x86_64 0:1.10.2-1.el6                                                                                                    

作为依赖被安装:
  nginx-all-modules.noarch 0:1.10.2-1.el6                     nginx-filesystem.noarch 0:1.10.2-1.el6                            
  nginx-mod-http-geoip.x86_64 0:1.10.2-1.el6                  nginx-mod-http-image-filter.x86_64 0:1.10.2-1.el6                 
  nginx-mod-http-perl.x86_64 0:1.10.2-1.el6                   nginx-mod-http-xslt-filter.x86_64 0:1.10.2-1.el6                  
  nginx-mod-mail.x86_64 0:1.10.2-1.el6                        nginx-mod-stream.x86_64 0:1.10.2-1.el6                            

完毕!
[root@localhost ~]# nginx -v
nginx version: nginx/1.10.2
[root@localhost ~]#

MySQL:通过RPM包安装:

[root@localhost ~]# wget https://dev.mysql.com/get/Downloads/MySQL-5.6/MySQL-5.6.41-1.el6.x86_64.rpm-bundle.tar
..
..
100%[=======================================================================================>] 227,512,320 1.21M/s   in 2m 26s  

2018-09-04 14:51:22 (1.48 MB/s) - 已保存 “MySQL-5.6.41-1.el6.x86_64.rpm-bundle.tar” [227512320/227512320])

[root@localhost ~]# ll MySQL-5.6.41-1.el6.x86_64.rpm-bundle.tar 
-rw-r--r--. 1 root root 227512320 6月  18 16:11 MySQL-5.6.41-1.el6.x86_64.rpm-bundle.tar
[root@localhost ~]# tar -zxvf MySQL-5.6.41-1.el6.x86_64.rpm-bundle.tar 

gzip: stdin: not in gzip format
tar: Child returned status 1
tar: Error is not recoverable: exiting now
[root@localhost ~]# tar xvf MySQL-5.6.41-1.el6.x86_64.rpm-bundle.tar 
MySQL-client-5.6.41-1.el6.x86_64.rpm
MySQL-shared-compat-5.6.41-1.el6.x86_64.rpm
MySQL-test-5.6.41-1.el6.x86_64.rpm
MySQL-server-5.6.41-1.el6.x86_64.rpm
MySQL-devel-5.6.41-1.el6.x86_64.rpm
MySQL-shared-5.6.41-1.el6.x86_64.rpm
MySQL-embedded-5.6.41-1.el6.x86_64.rpm
[root@localhost ~]# rpm -ivh MySQL-server-5.6.41-1.el6.x86_64.rpm 
warning: MySQL-server-5.6.41-1.el6.x86_64.rpm: Header V3 DSA/SHA1 Signature, key ID 5072e1f5: NOKEY
error: Failed dependencies:
        libnuma.so.1()(64bit) is needed by MySQL-server-5.6.41-1.el6.x86_64
        libnuma.so.1(libnuma_1.1)(64bit) is needed by MySQL-server-5.6.41-1.el6.x86_64
        libnuma.so.1(libnuma_1.2)(64bit) is needed by MySQL-server-5.6.41-1.el6.x86_64
[root@localhost ~]#

根据错误提示,安装numactl:

[root@localhost ~]# yum install numactl
已加载插件:fastestmirror
设置安装进程
Loading mirror speeds from cached hostfile
 * base: mirrors.163.com
 * epel: mirrors.ustc.edu.cn
 * extras: mirrors.shu.edu.cn
 * updates: mirrors.zju.edu.cn
解决依赖关系
--> 执行事务检查
---> Package numactl.x86_64 0:2.0.9-2.el6 will be 安装
--> 完成依赖关系计算

依赖关系解决

=================================================================================================================================
 软件包                        架构                         版本                                仓库                        大小
=================================================================================================================================
正在安装:
 numactl                       x86_64                       2.0.9-2.el6                         base                        74 k

事务概要
=================================================================================================================================
Install       1 Package(s)

总下载量:74 k
Installed size: 171 k
确定吗?[y/N]:y
下载软件包:
numactl-2.0.9-2.el6.x86_64.rpm                                                                            |  74 kB     00:00     
运行 rpm_check_debug 
执行事务测试
事务测试成功
执行事务
  正在安装   : numactl-2.0.9-2.el6.x86_64                                                                                    1/1 
  Verifying  : numactl-2.0.9-2.el6.x86_64                                                                                    1/1 

已安装:
  numactl.x86_64 0:2.0.9-2.el6                                                                                                   

完毕!
[root@localhost ~]# rpm -ivh MySQL-server-5.6.41-1.el6.x86_64.rpm 
warning: MySQL-server-5.6.41-1.el6.x86_64.rpm: Header V3 DSA/SHA1 Signature, key ID 5072e1f5: NOKEY
Preparing...                ########################################### [100%]
        file /usr/share/mysql/czech/errmsg.sys from install of MySQL-server-5.6.41-1.el6.x86_64 conflicts with file from package mysql-libs-5.1.71-1.el6.x86_64
..
..
file /usr/share/mysql/charsets/swe7.xml from install of MySQL-server-5.6.41-1.el6.x86_64 conflicts with file from package mysql-libs-5.1.71-1.el6.x86_64
[root@localhost ~]#

再根据提示,系统自带mysql-libs-5.1.71与当前要安装的依赖冲突,先删除掉:

[root@localhost ~]# yum erase mysql-libs-5.1.71-1.el6.x86_64
已加载插件:fastestmirror
设置移除进程
解决依赖关系
--> 执行事务检查
---> Package mysql-libs.x86_64 0:5.1.71-1.el6 will be 删除
--> 处理依赖关系 libmysqlclient.so.16()(64bit),它被软件包 2:postfix-2.6.6-2.2.el6_1.x86_64 需要
--> 处理依赖关系 libmysqlclient.so.16(libmysqlclient_16)(64bit),它被软件包 2:postfix-2.6.6-2.2.el6_1.x86_64 需要
--> 处理依赖关系 mysql-libs,它被软件包 2:postfix-2.6.6-2.2.el6_1.x86_64 需要
--> 执行事务检查
---> Package postfix.x86_64 2:2.6.6-2.2.el6_1 will be 删除
--> 处理依赖关系 /usr/sbin/sendmail,它被软件包 cronie-1.4.4-12.el6.x86_64 需要
--> 执行事务检查
---> Package cronie.x86_64 0:1.4.4-12.el6 will be 删除
--> 处理依赖关系 cronie = 1.4.4-12.el6,它被软件包 cronie-anacron-1.4.4-12.el6.x86_64 需要
--> 执行事务检查
---> Package cronie-anacron.x86_64 0:1.4.4-12.el6 will be 删除
--> 处理依赖关系 /etc/cron.d,它被软件包 crontabs-1.10-33.el6.noarch 需要
--> 使用新的信息重新计算依赖关系
--> 执行事务检查
---> Package crontabs.noarch 0:1.10-33.el6 will be 删除
--> 完成依赖关系计算

依赖关系解决

=============================================================================================================================================================================
 软件包                              架构                        版本                                    仓库                                                           大小
=============================================================================================================================================================================
正在删除:
 mysql-libs                          x86_64                      5.1.71-1.el6                            @anaconda-CentOS-201311272149.x86_64/6.5                      4.0 M
为依赖而移除:
 cronie                              x86_64                      1.4.4-12.el6                            @anaconda-CentOS-201311272149.x86_64/6.5                      174 k
 cronie-anacron                      x86_64                      1.4.4-12.el6                            @anaconda-CentOS-201311272149.x86_64/6.5                       43 k
 crontabs                            noarch                      1.10-33.el6                             @anaconda-CentOS-201311272149.x86_64/6.5                      2.4 k
 postfix                             x86_64                      2:2.6.6-2.2.el6_1                       @anaconda-CentOS-201311272149.x86_64/6.5                      9.7 M

事务概要
=============================================================================================================================================================================
Remove        5 Package(s)

Installed size: 14 M
确定吗?[y/N]:y
下载软件包:
运行 rpm_check_debug 
执行事务测试
事务测试成功
执行事务
  正在删除   : cronie-anacron-1.4.4-12.el6.x86_64                                                                                                                        1/5 
  正在删除   : crontabs-1.10-33.el6.noarch                                                                                                                               2/5 
  正在删除   : cronie-1.4.4-12.el6.x86_64                                                                                                                                3/5 
  正在删除   : 2:postfix-2.6.6-2.2.el6_1.x86_64                                                                                                                          4/5 
  正在删除   : mysql-libs-5.1.71-1.el6.x86_64                                                                                                                            5/5 
  Verifying  : crontabs-1.10-33.el6.noarch                                                                                                                               1/5 
  Verifying  : cronie-anacron-1.4.4-12.el6.x86_64                                                                                                                        2/5 
  Verifying  : cronie-1.4.4-12.el6.x86_64                                                                                                                                3/5 
  Verifying  : 2:postfix-2.6.6-2.2.el6_1.x86_64                                                                                                                          4/5 
  Verifying  : mysql-libs-5.1.71-1.el6.x86_64                                                                                                                            5/5 

删除:
  mysql-libs.x86_64 0:5.1.71-1.el6                                                                                                                                           

作为依赖被删除:
  cronie.x86_64 0:1.4.4-12.el6           cronie-anacron.x86_64 0:1.4.4-12.el6           crontabs.noarch 0:1.10-33.el6           postfix.x86_64 2:2.6.6-2.2.el6_1          

完毕!
[root@localhost ~]#

接着安装MySQL-server:

[root@localhost ~]# rpm -ivh MySQL-server-5.6.41-1.el6.x86_64.rpm 
warning: MySQL-server-5.6.41-1.el6.x86_64.rpm: Header V3 DSA/SHA1 Signature, key ID 5072e1f5: NOKEY
Preparing...                ########################################### [100%]
   1:MySQL-server           ########################################### [100%]
warning: user mysql does not exist - using root
warning: group mysql does not exist - using root
warning: user mysql does not exist - using root
warning: group mysql does not exist - using root
2018-09-04 15:09:54 0 [Warning] TIMESTAMP with implicit DEFAULT value is deprecated. Please use --explicit_defaults_for_timestamp server option (see documentation for more details).
2018-09-04 15:09:54 0 [Note] Ignoring --secure-file-priv value as server is running with --bootstrap.
2018-09-04 15:09:54 0 [Note] /usr/sbin/mysqld (mysqld 5.6.41) starting as process 1647 ...
2018-09-04 15:09:54 1647 [Note] InnoDB: Using atomics to ref count buffer pool pages
..
..
A RANDOM PASSWORD HAS BEEN SET FOR THE MySQL root USER !
You will find that password in '/root/.mysql_secret'.

You must change that password on your first connect,
no other statement but 'SET PASSWORD' will be accepted.
See the manual for the semantics of the 'password expired' flag.

Also, the account for the anonymous user has been removed.

..
..
New default config file was created as /usr/my.cnf and
will be used by default by the server when you start it.
You may edit this file to change server settings

[root@localhost ~]# 

安装MySQL客户端:

[root@localhost ~]# rpm -ivh MySQL-client-5.6.41-1.el6.x86_64.rpm 
warning: MySQL-client-5.6.41-1.el6.x86_64.rpm: Header V3 DSA/SHA1 Signature, key ID 5072e1f5: NOKEY
Preparing...                ########################################### [100%]
   1:MySQL-client           ########################################### [100%]
[root@localhost ~]#

启动MySQL,用系统生成的随机口令先登录数据库,然后修改root口令,再创建新的库和用户blog,用于恢复原站点的数据库:

[root@localhost ~]# cat .mysql_secret 
# The random password set for the root user at Tue Sep  4 15:09:55 2018 (local time): QKkCVRsNEhJZEZj0

[root@localhost ~]# service mysql status
 ERROR! MySQL is not running
[root@localhost ~]# service mysql start
Starting MySQL.Logging to '/var/lib/mysql/localhost.localdomain.err'.
... SUCCESS! 
[root@localhost ~]# service mysql status
 SUCCESS! MySQL running (2098)
[root@localhost ~]# mysql -h localhost -uroot -p
Enter password: 
Welcome to the MySQL monitor.  Commands end with ; or \g.
Your MySQL connection id is 1
Server version: 5.6.41

Copyright (c) 2000, 2018, Oracle and/or its affiliates. All rights reserved.

Oracle is a registered trademark of Oracle Corporation and/or its
affiliates. Other names may be trademarks of their respective
owners.

Type 'help;' or '\h' for help. Type '\c' to clear the current input statement.

mysql> SET PASSWORD=password('localblog');
Query OK, 0 rows affected (0.00 sec)

mysql> create database blog CHARACTER SET utf8;
Query OK, 1 row affected (0.00 sec)

mysql> create user 'blog'@'localhost' identified by 'blog123';
Query OK, 0 rows affected (0.00 sec)

mysql> grant all privileges on blog.* to 'blog'@'localhost' with grant option;
Query OK, 0 rows affected (0.00 sec)

mysql> flush privileges;
Query OK, 0 rows affected (0.00 sec)

mysql> exit
Bye
[root@localhost ~]# 

PHP:yum安装。

[root@localhost ~]# yum install php php-fpm
已加载插件:fastestmirror
..
..
已安装:
  php.x86_64 0:5.3.3-49.el6                                                           php-fpm.x86_64 0:5.3.3-49.el6                                                          

作为依赖被安装:
  apr.x86_64 0:1.3.9-5.el6_9.1                   apr-util.x86_64 0:1.3.9-3.el6_0.1      apr-util-ldap.x86_64 0:1.3.9-3.el6_0.1      httpd.x86_64 0:2.2.15-69.el6.centos     
  httpd-tools.x86_64 0:2.2.15-69.el6.centos      mailcap.noarch 0:2.1.31-2.el6          php-cli.x86_64 0:5.3.3-49.el6               php-common.x86_64 0:5.3.3-49.el6        

完毕!
[root@localhost ~]# yum install php php-fpm

四 配置NGINX

这里,由于我是在本地服务器上模拟站点迁移,并没有新的域名。于是,我用NGINX模拟反向解析一个新的域名:blog.com,然后,把blog.com配置到本地hosts文件。

NGINX的配置文件路径为,/etc/nginx/conf.d。内容如下:

[root@localhost blog]# cat /etc/nginx/conf.d/blog.conf 
#
# The default server
#
server {
    listen       80;
    server_name  blog.com;

    #charset koi8-r;

    #access_log  logs/host.access.log  main;

    location / {
        root   /blog;
        index index.php  index.html index.htm;
    }

    error_page  404              /404.html;
    location = /404.html {
        root   /usr/share/nginx/html;
    }

    # redirect server error pages to the static page /50x.html
    #
    error_page   500 502 503 504  /50x.html;
    location = /50x.html {
        root   /usr/share/nginx/html;
    }

    # proxy the PHP scripts to Apache listening on 127.0.0.1:80
    #
    #location ~ \.php$ {
    #    proxy_pass   http://127.0.0.1;
    #}

    # pass the PHP scripts to FastCGI server listening on 127.0.0.1:9000
    #
    location ~ \.php$ {
        root           /blog;
        fastcgi_pass   127.0.0.1:9000;
        fastcgi_index  index.php;
        fastcgi_param  SCRIPT_FILENAME  $document_root$fastcgi_script_name;
        include        fastcgi_params;
    }

    # deny access to .htaccess files, if Apache's document root
    # concurs with nginx's one
    #
    #location ~ /\.ht {
    #    deny  all;
    #}
}
[root@localhost blog]#

该配置文件中的blog.com就是我要通过NGINX来反向代理的站点,/blog指的是我的站点的根目录。
然后,本地hosts文件中,把blog.com,指向172.16.11.96,添加如下一条记录即可:

172.16.11.80 blog.com
且,可以正常访问:
$ ping blog.com
PING blog.com (172.16.11.80): 56 data bytes
64 bytes from 172.16.11.80: icmp_seq=0 ttl=63 time=0.561 ms
64 bytes from 172.16.11.80: icmp_seq=1 ttl=63 time=0.638 ms
^C
--- blog.com ping statistics ---
2 packets transmitted, 2 packets received, 0.0% packet loss
round-trip min/avg/max/stddev = 0.561/0.600/0.638/0.039 ms

asher at MacBook-Air-3 in ~
$ 

五 安装Wordpress

WordPress官方网站,下载最新的安装包,然后解压,放到/blog路径下,修改/blog机器子路径的权限,owner为NGINX的启动用户。这里需要配合前面的第4步骤,前面的NGINX把blog.com反向解析到哪个路径,这里就需要把Wordpress安装在哪儿。

[root@localhost ~]# wget https://wordpress.org/latest.tar.gz
..
[root@localhost ~]# mkdir -p /blog
[root@localhost ~]# mv latest.tar.gz /blog/
[root@localhost ~]# cd /blog/
[root@localhost blog]# tar -zxvf latest.tar.gz 
[root@localhost blog]# mv ./wordpress/* .
[root@localhost blog]# chown -R nginx:nginx /blog/

启动,NGINX、php-fpm,执行安装:

[root@localhost ~]# service nginx restart
停止 nginx:                                               [确定]
正在启动 nginx:                                           [确定]
[root@localhost ~]# service php-fpm restart
停止 php-fpm:                                             [失败]
正在启动 php-fpm:                                         [确定]
[root@localhost ~]#

浏览器打开blog.com,遇到下述错误:
Your PHP installation appears to be missing the MySQL extension which is required by WordPress.
经排查,是PHP版本太低,卸载前面安装的低版本PHP和PHP-fpm,然后安装高版本PHP和PHP-fpm,以及相关依赖包:

[root@localhost ~]# php -v
PHP 5.3.3 (cli) (built: Mar 22 2017 12:27:09) 
Copyright (c) 1997-2010 The PHP Group
Zend Engine v2.3.0, Copyright (c) 1998-2010 Zend Technologies
[root@localhost ~]# yum erase php php-fpm
..
..
[root@localhost ~]# rpm -Uvh http://rpms.famillecollet.com/enterprise/remi-release-6.rpm
Retrieving http://rpms.famillecollet.com/enterprise/remi-release-6.rpm
Preparing...                ########################################### [100%]
   1:remi-release           ########################################### [100%]
[root@localhost ~]# yum install --enablerepo=remi --enablerepo=remi-php56 php php-fpm php-opcache php-devel php-mbstring php-mcrypt php-mysqlnd php-phpunit-PHPUnit php-pecl-xdebug php-pecl-xhprof 
..
..

再启动NGINX、php-fpm,执行安装:

[root@localhost blog]# php -v
PHP 5.6.37 (cli) (built: Jul 19 2018 20:06:19) 
Copyright (c) 1997-2016 The PHP Group
Zend Engine v2.6.0, Copyright (c) 1998-2016 Zend Technologies
    with Zend OPcache v7.0.6-dev, Copyright (c) 1999-2016, by Zend Technologies
    with Xdebug v2.5.5, Copyright (c) 2002-2017, by Derick Rethans
[root@localhost blog]# service nginx restart
停止 nginx:                                               [确定]
正在启动 nginx:                                           [确定]
[root@localhost blog]# service php-fpm restart
停止 php-fpm:                                             [确定]
正在启动 php-fpm:                                         [确定]
[root@localhost blog]#

开始安装:

根据提示,填入前面配置MySQL数据库的时候,创建的数据库名blog,用户名blog及密码:

根据提示,安装程序无法创建wp-config.php配置文件,手工拷贝内容,在/blog路径下,创建该文件,内容为上述信息。继续安装:

设置超管用户的密码,这里只是测试,简单起见,设置blog、blog,真实环境下,要注意复杂度。

六 还原MySQL数据库:

解压缩之前创建的MySQL数据库备份文件:

[root@localhost ~]# gzip -d oracleon_oracle.sql.gz
[root@localhost ~]# ll oracleon_oracle.sql
-rw-r--r--. 1 root root 15662095 9月 3 19:53 oracleon_oracle.sql
[root@localhost ~]#

blog用户登录数据库blog,执行脚本恢复:

  
[root@localhost ~]# mysql -h localhost -u blog -p
Enter password: 
Welcome to the MySQL monitor.  Commands end with ; or \g.
Your MySQL connection id is 22
Server version: 5.6.41 MySQL Community Server (GPL)

Copyright (c) 2000, 2018, Oracle and/or its affiliates. All rights reserved.

Oracle is a registered trademark of Oracle Corporation and/or its
affiliates. Other names may be trademarks of their respective
owners.

Type 'help;' or '\h' for help. Type '\c' to clear the current input statement.

mysql> use blog;
Reading table information for completion of table and column names
You can turn off this feature to get a quicker startup with -A

Database changed
mysql> show tables;
+-----------------------+
| Tables_in_blog        |
+-----------------------+
| wp_commentmeta        |
| wp_comments           |
| wp_links              |
| wp_options            |
| wp_postmeta           |
| wp_posts              |
| wp_term_relationships |
| wp_term_taxonomy      |
| wp_termmeta           |
| wp_terms              |
| wp_usermeta           |
| wp_users              |
+-----------------------+
12 rows in set (0.00 sec)

mysql> source ./oracleon_oracle.sql
..
..
Query OK, 0 rows affected (0.00 sec)

mysql>

七 修改数据库中关于旧站点的连接信息:

mysql> UPDATE wp_options SET option_value = replace(option_value, 'www.oracleonlinux.cn','blog.com');
Query OK, 6 rows affected (0.02 sec)
Rows matched: 367  Changed: 6  Warnings: 0

mysql> UPDATE wp_options SET option_value = replace(option_value, 'oracleonlinux.cn','blog.com');
Query OK, 2 rows affected (0.01 sec)
Rows matched: 367  Changed: 2  Warnings: 0

mysql> UPDATE wp_posts SET post_content = replace(post_content, 'www.oracleonlinux.cn','blog.com');
Query OK, 95 rows affected (0.06 sec)
Rows matched: 735  Changed: 95  Warnings: 0

mysql> UPDATE wp_posts SET post_content = replace(post_content, 'oracleonlinux.cn','blog.com');
Query OK, 13 rows affected (0.07 sec)
Rows matched: 735  Changed: 13  Warnings: 0

mysql> UPDATE wp_comments SET comment_content = replace(comment_content, 'www.oracleonlinux.cn', 'blog.com');
Query OK, 8 rows affected (0.01 sec)
Rows matched: 284  Changed: 8  Warnings: 0

mysql> UPDATE wp_comments SET comment_content = replace(comment_content, 'oracleonlinux.cn', 'blog.com');
Query OK, 1 row affected (0.01 sec)
Rows matched: 284  Changed: 1  Warnings: 0

mysql> UPDATE wp_comments SET comment_author_url = replace(comment_author_url, 'www.oracleonlinux.cn', 'blog.com');
Query OK, 66 rows affected (0.01 sec)
Rows matched: 284  Changed: 66  Warnings: 0

mysql> UPDATE wp_comments SET comment_author_url = replace(comment_author_url, 'oracleonlinux.cn', 'blog.com');
Query OK, 10 rows affected (0.01 sec)
Rows matched: 284  Changed: 10  Warnings: 0

mysql> 

八 登录后台查看信息:

注意,这里需要使用旧站点的管理员用户和密码,因为后台的MySQL数据库中已经导入之前的数据库备份信息了。

登录之后,可以看到之前站点上发布的所有文章和数据。这里,需要重新安装以及启用之前站点上的主题和插件。

九 设置NGINX的静态解析

由于之前的网站是LAMP,用Apache解析的,现在改为NGINX代理的话,需要重新配置静态解析。否则的话,会出现主页访问正常,但是其它页面以及标签页和单篇文章打开时报404错误。

在nginx的配置文件的location / 位置处,加上下述信息:

 if (!-e $request_filename) {
            rewrite ^([_0-9a-zA-Z-]+)?(/wp-.*) $2 last;
            rewrite ^([_0-9a-zA-Z-]+)?(/.*\.php)$ $2 last;
            rewrite ^ /index.php last;
        }

完整的用于该站点的反向代理解析文件如下:

#
# The default server
#
server {
    listen       80;
    server_name  blog.com;

    #charset koi8-r;

    #access_log  logs/host.access.log  main;

    location / {
        root   /blog;
        index index.php  index.html index.htm;
        
        if (!-e $request_filename) {
            rewrite ^([_0-9a-zA-Z-]+)?(/wp-.*) $2 last;
            rewrite ^([_0-9a-zA-Z-]+)?(/.*\.php)$ $2 last;
            rewrite ^ /index.php last;
        }
    }

    error_page  404              /404.html;
    location = /404.html {
        root   /usr/share/nginx/html;
    }

    # redirect server error pages to the static page /50x.html
    #
    error_page   500 502 503 504  /50x.html;
    location = /50x.html {
        root   /usr/share/nginx/html;
    }

    # proxy the PHP scripts to Apache listening on 127.0.0.1:80
    #
    #location ~ \.php$ {
    #    proxy_pass   http://127.0.0.1;
    #}

    # pass the PHP scripts to FastCGI server listening on 127.0.0.1:9000
    #
    location ~ \.php$ {
        root           /blog;
        fastcgi_pass   127.0.0.1:9000;
        fastcgi_index  index.php;
        fastcgi_param  SCRIPT_FILENAME  $document_root$fastcgi_script_name;
        include        fastcgi_params;
    }

    # deny access to .htaccess files, if Apache's document root
    # concurs with nginx's one
    #
    #location ~ /\.ht {
    #    deny  all;
    #}
}

最后,可以在本地看到的站点如下:

PostgreSQL数据库排序的小结

一 OS环境

 [root@localhost ~]# cat /etc/redhat-release 
CentOS release 6.5 (Final)
[root@localhost ~]# uname -rm
2.6.32-431.el6.x86_64 x86_64
[root@localhost ~]# free -m
             total       used       free     shared    buffers     cached
Mem:         48216      47094       1122          0        286      44795
-/+ buffers/cache:       2012      46204
Swap:        24175       1712      22463
[root@localhost ~]#

二 数据库环境

ai=> select version();
                                                 version                                                  
----------------------------------------------------------------------------------------------------------
 PostgreSQL 9.6.4 on x86_64-pc-linux-gnu, compiled by gcc (GCC) 4.4.7 20120313 (Red Hat 4.4.7-18), 64-bit
(1 row)

ai=> \dt+ t_btree 
                    List of relations
 Schema |  Name   | Type  | Owner |  Size  | Description 
--------+---------+-------+-------+--------+-------------
 public | t_btree | table | ai    | 346 MB | 
(1 row)

ai=> select count(*) from t_btree ;
  count   
----------
 10000000
(1 row)

ai=>

三 external merge

ai=> show shared_buffers ;
 shared_buffers 
----------------
 128MB
(1 row)

ai=> show work_mem ;
 work_mem 
----------
 4MB
(1 row)

ai=> explain (analyze,verbose,buffers,costs,timing) select * from t_btree order by id;
                                                            QUERY PLAN                                                             
-----------------------------------------------------------------------------------------------------------------------------------
 Sort  (cost=1580363.83..1605363.83 rows=10000000 width=4) (actual time=8397.774..10610.457 rows=10000000 loops=1)
   Output: id
   Sort Key: t_btree.id
   Sort Method: external merge  Disk: 136936kB
   Buffers: shared hit=15871 read=28377, temp read=50518 written=50518
   ->  Seq Scan on public.t_btree  (cost=0.00..144248.00 rows=10000000 width=4) (actual time=0.028..861.348 rows=10000000 loops=1)
         Output: id
         Buffers: shared hit=15871 read=28377
 Planning time: 2.056 ms
 Execution time: 11135.532 ms
(10 rows)

ai=>

这里的排序方法采用的external mege,意味着数据量太大了,在内存里排序排不下(work_mem=4MB对于当前场景的排序,不够用),只好交换到磁盘上排序,磁盘排序完成之后,再把排序结果交换到内存中。效率最低。

shared_buffers相当于Oracle数据库的database buffer cache,单纯加大该参数,即使所有的数据都能从shared buffers命中,对该排序依然无效,如下:

ai=> explain (analyze,verbose,buffers,costs,timing) select id from t_btree order by id;
                                                            QUERY PLAN                                                             
-----------------------------------------------------------------------------------------------------------------------------------
 Sort  (cost=1580363.83..1605363.83 rows=10000000 width=4) (actual time=8032.685..10126.444 rows=10000000 loops=1)
   Output: id
   Sort Key: t_btree.id
   Sort Method: external merge  Disk: 136936kB
   Buffers: shared hit=44248, temp read=50518 written=50518
   ->  Seq Scan on public.t_btree  (cost=0.00..144248.00 rows=10000000 width=4) (actual time=0.021..792.516 rows=10000000 loops=1)
         Output: id
         Buffers: shared hit=44248
 Planning time: 0.062 ms
 Execution time: 10655.508 ms
(10 rows)

ai=> select 44248*8;
 ?column? 
----------
   353984
(1 row)

ai=> select 44248*8/1024.0;
       ?column?       
----------------------
 345.6875000000000000
(1 row)

ai=> show shared_buffers ;
 shared_buffers 
----------------
 4GB
(1 row)

ai=> show work_mem ;
 work_mem 
----------
 4MB
(1 row)

ai=>

shared_buffers=4GB,work_mem=4MB时。执行计划中,Buffers: shared hit=44248,内存命中44248个内存块儿,每个内存页8KB,换算之后,约为346MB,足够缓存该表的全部数据,即所有数据都从内存中读取。但是,排序方法依然是external merge。

四 quicksort排序

ai=> show shared_buffers ;
 shared_buffers 
----------------
 512MB
(1 row)

ai=> show work_mem ;
 work_mem 
----------
 4MB
(1 row)

ai=> set work_mem ='800MB';
SET
ai=> show work_mem ;
 work_mem 
----------
 800MB
(1 row)

ai=> explain (analyze,verbose,buffers,costs,timing) select * from t_btree order by id;
                                                            QUERY PLAN                                                             
-----------------------------------------------------------------------------------------------------------------------------------
 Sort  (cost=1306922.83..1331922.83 rows=10000000 width=4) (actual time=15001.049..17213.924 rows=10000000 loops=1)
   Output: id
   Sort Key: t_btree.id
   Sort Method: quicksort  Memory: 741817kB
   Buffers: shared hit=15903 read=28345
   ->  Seq Scan on public.t_btree  (cost=0.00..144248.00 rows=10000000 width=4) (actual time=0.060..920.913 rows=10000000 loops=1)
         Output: id
         Buffers: shared hit=15903 read=28345
 Planning time: 0.054 ms
 Execution time: 17756.761 ms
(10 rows)

ai=> explain (analyze,verbose,buffers,costs,timing) select * from t_btree order by id;
                                                            QUERY PLAN                                                             
-----------------------------------------------------------------------------------------------------------------------------------
 Sort  (cost=1306922.83..1331922.83 rows=10000000 width=4) (actual time=6075.205..7945.550 rows=10000000 loops=1)
   Output: id
   Sort Key: t_btree.id
   Sort Method: quicksort  Memory: 741817kB
   Buffers: shared hit=16063 read=28185
   ->  Seq Scan on public.t_btree  (cost=0.00..144248.00 rows=10000000 width=4) (actual time=0.060..879.729 rows=10000000 loops=1)
         Output: id
         Buffers: shared hit=16063 read=28185
 Planning time: 0.070 ms
 Execution time: 8466.822 ms
(10 rows)

ai=> explain (analyze,verbose,buffers,costs,timing) select * from t_btree order by id;
                                                            QUERY PLAN                                                             
-----------------------------------------------------------------------------------------------------------------------------------
 Sort  (cost=1306922.83..1331922.83 rows=10000000 width=4) (actual time=5400.587..7208.614 rows=10000000 loops=1)
   Output: id
   Sort Key: t_btree.id
   Sort Method: quicksort  Memory: 741817kB
   Buffers: shared hit=16095 read=28153
   ->  Seq Scan on public.t_btree  (cost=0.00..144248.00 rows=10000000 width=4) (actual time=0.059..847.957 rows=10000000 loops=1)
         Output: id
         Buffers: shared hit=16095 read=28153
 Planning time: 0.068 ms
 Execution time: 7724.861 ms
(10 rows)

ai=>

说明:

1 默认情况下work_mem=4MB,不满足在内存中完成该排序操作,通过向上调整work_mem=800MB ,使其能够在内存中完成该排序,这里的800MB是逐渐上调得到的一个值。为了学习研究用,实际生产环境,调整该参数值时,要注意该值work_mem*max_connections不能超过总物理内存大小;

2 调整完work_mem=800MB后,多次观察该SQL的执行计划,可以发现随着Buffers: shared hit=16095 read=28153的变化,其Execution time逐渐降低。

This will definitely be faster than external merge, since all of the data is brought into memory and then the sorting is done in memory itself.

五  top-N heapsort

ai=> show work_mem ;
 work_mem 
----------
 4MB
(1 row)

ai=> show shared_buffers ;
 shared_buffers 
----------------
 128MB
(1 row)

ai=> explain (analyze,verbose,buffers,costs,timing) select id from t_btree order by id limit 10;
                                                               QUERY PLAN                                                                
-----------------------------------------------------------------------------------------------------------------------------------------
 Limit  (cost=360344.40..360344.43 rows=10 width=4) (actual time=1784.116..1784.117 rows=10 loops=1)
   Output: id
   Buffers: shared hit=3 read=44248
   ->  Sort  (cost=360344.40..385344.40 rows=10000000 width=4) (actual time=1784.113..1784.113 rows=10 loops=1)
         Output: id
         Sort Key: t_btree.id
         Sort Method: top-N heapsort  Memory: 25kB
         Buffers: shared hit=3 read=44248
         ->  Seq Scan on public.t_btree  (cost=0.00..144248.00 rows=10000000 width=4) (actual time=0.023..856.626 rows=10000000 loops=1)
               Output: id
               Buffers: shared read=44248
 Planning time: 0.396 ms
 Execution time: 1784.149 ms
(13 rows)

ai=>

说明:

1 这里SQL加上了limit 10,则执行计划选择了top-N heapsort,同时,内存只用了25kB。

2 PostgreSQL数据库维护了一个heap的内存结构,该heap有一个上限大小。排序过程大致如下:PostgreSQL先根据limit大小,顺序的把数据放入heap中,等到heap被填满之后,再去读取下一个数据,判断其值是否小于heap中已有的最大值?如果大于最大值,则直接丢弃这个数据,返回heap中的结果集,排序完成。如果小于最大值,则把这个值放入heap中的最大值处,并把heap中之前的那个最大值移除heap,继续读取下一个值,重复该过程,直到读取的新值不再大于heap中的最大值为止。

3 由于SQL中有order by id,才会涉及到排序操作,如果没有这个order by从句的话,那么无需涉及排序,直接返回表中读取的前10条记录;

4 这里无需对整个表进行排序,只需获取最小的10条数据,并对其进行排序即可。

六 index 排序

ai=> create index idx_t_btree_id on t_btree(id);
CREATE INDEX
ai=> show work_mem ;
 work_mem 
----------
 4MB
(1 row)

ai=> show shared_buffers ;
 shared_buffers 
----------------
 128MB
(1 row)

ai=> explain (analyze,verbose,buffers,costs,timing) select * from t_btree order by id limit 10;
                                                                      QUERY PLAN                                                                       
-------------------------------------------------------------------------------------------------------------------------------------------------------
 Limit  (cost=0.43..0.87 rows=10 width=4) (actual time=0.030..0.045 rows=10 loops=1)
   Output: id
   Buffers: shared hit=13
   ->  Index Only Scan using idx_t_btree_id on public.t_btree  (cost=0.43..436680.67 rows=10000033 width=4) (actual time=0.028..0.039 rows=10 loops=1)
         Output: id
         Heap Fetches: 10
         Buffers: shared hit=13
 Planning time: 0.120 ms
 Execution time: 0.066 ms
(9 rows)

ai=> explain (analyze,verbose,buffers,costs,timing) select * from t_btree order by id desc limit 10;
                                                                           QUERY PLAN                                                                           
----------------------------------------------------------------------------------------------------------------------------------------------------------------
 Limit  (cost=0.43..0.87 rows=10 width=4) (actual time=0.024..0.038 rows=10 loops=1)
   Output: id
   Buffers: shared hit=12 read=1
   ->  Index Only Scan Backward using idx_t_btree_id on public.t_btree  (cost=0.43..436680.67 rows=10000033 width=4) (actual time=0.022..0.035 rows=10 loops=1)
         Output: id
         Heap Fetches: 10
         Buffers: shared hit=12 read=1
 Planning time: 0.213 ms
 Execution time: 0.061 ms
(9 rows)

ai=>

说明:

实际情况下,通过index来访问数据,并不是严格意义的排序,只不过是index本身已经是排好序的数据集,数据库只需直接从index读取数据即可,并不需要执行额外的排序操作。这里,id字段上有一个B-tree index,无论是按照id的升序、降序排序,都可以直接从index读取数据。

七 小结

1 此前,并没有认真的关注过external merge排序操作,原来是因为内存空间不够,work_mem内存区不足以用于排序的操作,故而数据库不得不采用将数据交换到磁盘排序,然后把排序结果交换回内存;

2 quick sort是一种成熟的排序方法,大学的数据结构课程学过,早已还给老师了,找时间回顾一下该知识点;

3 heap sort方法对于自己是一种新的排序,通过小结,也大致清楚了其排序的实现方式。

八 参考

https://madusudanan.com/blog/all-you-need-to-know-about-sorting-in-postgres/

另辟蹊径的一则PostgreSQL数据库SQL优化案例

一 问题现象

早上,收到项目组诉求,业务系统的某个模块从昨天下午3:30左右出现有数据插入失败的情况。希望能从数据库端或者服务器上看看有没有异常现象,并给予支持。

登录到数据库控制台上,经过初步排查发现,看到下述现象:


从昨天上午10:29开始,系统频繁出现类似插入SQL,且每次执行耗时1秒。更为糟糕的是,该类型SQL一直持续到今天早上,不停的在执行。

二 分析问题

拎出其中一条SQL进行分析

INSERT
INTO t_ai_prd_history_effective_record
  (
    ID,
    create_time,
    cust_category,
    cust_id,
    cust_name,
    company_id,
    company_name,
    template_no,
    template_name,
    template_field_identifier,
    template_field_name,
    submit_value
  )
SELECT random_string (32),
  now(),
  $1,
  $2,
  $3,
  $4,
  $5,
  $6,
  $7,
  $8,
  $9,
  $10
WHERE NOT EXISTS
  (SELECT 1
  FROM t_ai_prd_history_effective_record r
  WHERE COALESCE (r.cust_category, '')           = COALESCE ($11, '')
  AND COALESCE (r.cust_id, '')                   = COALESCE ($12, '')
  AND COALESCE (r.company_id, '')                = COALESCE ($13, '')
  AND COALESCE (r.template_no, '')               = COALESCE ($14, '')
  AND COALESCE (r.template_field_identifier, '') = COALESCE ($15,'')
  AND COALESCE (r.submit_value, '')              = COALESCE ($16, '')
  )

对应的参数为:

params: $1                                   = 'MY001',
  $2                                             = 'b8168c7513014b0c9769f3d61574833d',
  $3                                             = 'WP MANAGEMENT SERVICES',
  $4                                             = '1BABS7HSS5UH01FE140A000085535171',
  $5                                             = 'KLINIK PERGIGIAN M DENTAL',
  $6                                             = 'MYBL0303',
  $7                                             = 'Expenses',
  $8                                             = 'InvoiceDate',
  $9                                             = 'InvoiceDate(发票日期)',
  $10                                            = '20170614',
  $11                                            = 'MY001',
  $12                                            = 'b8168c7513014b0c9769f3d61574833d',
  $13                                            = '1BABS7HSS5UH01FE140A000085535171',
  $14                                            = 'MYBL0303',
  $15                                            = 'InvoiceDate',
  $16                                            = '20170614'

显然,该SQL的目的是要向表t_ai_prd_history_effective_record进行有条件的插入数据,其条件是表中不存在

COALESCE (r.cust_category, '')           = COALESCE ('DZ001', '')
ai->   AND COALESCE (r.cust_id, '')                   = COALESCE ('b151ad4f86ab4ec5aee8c4cc377e9eb7', '')
ai->   AND COALESCE (r.company_id, '')                = COALESCE ('04cb580238dc49af8bfb46e00e959a1a', '')
ai->   AND COALESCE (r.template_no, '')               = COALESCE ('KJDZ0101', '')
ai->   AND COALESCE (r.template_field_identifier, '') = COALESCE ('ItemQuantity','')
ai->   AND COALESCE (r.submit_value, '')              = COALESCE ('10100$__$6080$__$$__$$__$', '');

的情况下。具体体现在SQL中的WHERE NOT EXISTS。

那么,问题就明了了,应该是出现在NOT EXISTS的子查询上。

接下来,单独看看这个子查询的执行计划:

 ai=> explain analyze SELECT 1
ai->   FROM t_ai_prd_history_effective_record r
ai->   WHERE COALESCE (r.cust_category, '')           = COALESCE ('DZ001', '')
ai->   AND COALESCE (r.cust_id, '')                   = COALESCE ('b151ad4f86ab4ec5aee8c4cc377e9eb7', '')
ai->   AND COALESCE (r.company_id, '')                = COALESCE ('04cb580238dc49af8bfb46e00e959a1a', '')
ai->   AND COALESCE (r.template_no, '')               = COALESCE ('KJDZ0101', '')
ai->   AND COALESCE (r.template_field_identifier, '') = COALESCE ('ItemQuantity','')
ai->   AND COALESCE (r.submit_value, '')              = COALESCE ('10100$__$6080$__$$__$$__$', '');
                                                                                                                                                                                                                                                      QUERY PLAN
----------------------------------------------------------------------------------------------------------------------------------------------------------------------
 Seq Scan on t_ai_prd_history_effective_record r  (cost=0.00..203817.53 rows=1 width=0) (actual time=1266.116..1267.093 rows=1 loops=1)
   Filter: (((COALESCE(cust_category, ''::character varying))::text = 'DZ001'::text) AND ((COALESCE(cust_id, ''::character varying))::text = 'b151ad4f86ab4ec5aee8c4cc377e9eb7'::text) AND ((COALESCE(company_id, ''::character varying))::text = '04cb580238dc49af8bfb46e00e959a1a'::text) AND ((COALESCE(template_no, ''::character varying))::text = 'KJDZ0101'::text) AND ((COALESCE(template_field_identifier, ''::character varying))::text = 'ItemQuantity'::text) AND (COALESCE(submit_value, ''::text) = '10100$__$6080$__$$__$$__$'::text))
   Rows Removed by Filter: 3193300
 Planning time: 0.129 ms
 Execution time: 1267.133 ms
(5 rows)
ai=>

t_ai_prd_history_effective_record表数据量:

ai=> select count(*) from t_ai_prd_history_effective_record;
  count 
---------
 3193138
(1 row)
ai=>

意料之中,每次执行这个去重的不存在判断,都对这个拥有300多万条数据的t_ai_prd_history_effective_record表执行一次全表扫描,可想而知,执行效率肯定低下,每次耗时1秒多,且随着该表的数据不断增多,插入的速度将变得越来越慢。

这里,可以说是,每一条记录的插入,都将导致下一次插入变得更慢!

三 解决方案

找到了问题的症结,就要着手优化了。终极目标就是怎么可以绕过那个NOT exists的子查询?

经过和BPO部门林朝荣同学讨论,给出下述方案:

  1. 能不能对于t_ai_prd_history_effective_record表的子查询的那6个字段上建立一个唯一性索引,如果可以的话,那么我们就在插入的时候不再需要那个where条件判断去重了,而由这个唯一性索引的约束去做判断,如果插入重复数据的话,就违反约束,报错抛出异常。这样的话,看似解决了这个问题,但是,如果从业务上考虑的话,的确是存在过多的重复数据,如果报错的话,业务人员会在系统上频繁的收到报错信息,不是很友好。
  2. 既然这样的话,那问题就变的更简单了。直接粗暴的把SQL的where not exists的去重判断删掉,先一股脑儿的插入,不论是否重复,然后,写个批处理的SQL,放到晚上再统一把重复的记录删掉,问题不就解决了嘛。

给出一个删除PostgreSQL数据库表重复记录的示例:

ai=> create table t(id int primary key,name varchar(10),addr varchar(10));
CREATE TABLE
ai=> insert into t values(1,'onlyou.com','xiamen');
INSERT 0 1
ai=> insert into t values(2,'apple.com','usa');   
INSERT 0 1
ai=> insert into t values(3,'apple.com','usa');
INSERT 0 1
ai=> insert into t values(4,'google','usa');
INSERT 0 1
ai=> insert into t values(5,'google','usa');
INSERT 0 1
ai=> select * from t;
 id |    name    |  addr 
----+------------+--------
  1 | onlyou.com | xiamen
  2 | apple.com  | usa
  3 | apple.com  | usa
  4 | google     | usa
  5 | google     | usa
(5 rows)
ai=> select t1.id from t t1 where t1.ctid<>(select max(t2.ctid) from t t2 where t1.name=t2.name and t1.addr=t2.addr);
 id
----
  2
  4
(2 rows)
ai=> delete from t where id in(select t1.id from t t1 where t1.ctid<>(select max(t2.ctid) from t t2 where t1.name=t2.name and t1.addr=t2.addr));
DELETE 2
ai=> select * from t;                                                                                                                          
 id |    name    |  addr 
----+------------+--------
  1 | onlyou.com | xiamen
  3 | apple.com  | usa
  5 | google     | usa
(3 rows)
ai=>

四 小结

发现并找到慢SQL的问题所在,进行有针对性的优化改造,解决问题往往不一定难,深入思考一下多尝试。

以上,给出一个优化的思路和方向。

如何在PostgreSQL中使用partial index来优化SQL?

一 案例背景

从生产控制台上看到一条下述SQL:

格式化之后SQL语句为:

select '01' status, count(1) from t_ai_prd_item where status = '01' and deleted = false	
union all 
select '02' status, count(1) from t_ai_prd_item where status = '02' and deleted = false

一个union all的联合查询,每次执行耗时1秒。有没有优化余地呢?

 二 优化分析

下述通过copy原表t_ai_prd_item为t1,来进行分析优化。

1 看SQL执行计划及数据量分布:

ai=> explain analyze select '01' status, count(1) from t1 where status = '01' and deleted = false 
ai-> union all 
ai-> select '02' status, count(1) from t1 where status = '02' and deleted = false;
                                                         QUERY PLAN                                                          
-----------------------------------------------------------------------------------------------------------------------------
 Append  (cost=160483.13..320974.20 rows=2 width=40) (actual time=5211.374..6250.940 rows=2 loops=1)
   ->  Aggregate  (cost=160483.13..160483.14 rows=1 width=0) (actual time=5211.374..5211.374 rows=1 loops=1)
         ->  Seq Scan on t1  (cost=0.00..160483.12 rows=1 width=0) (actual time=5211.369..5211.369 rows=0 loops=1)
               Filter: ((NOT deleted) AND ((status)::text = '01'::text))
               Rows Removed by Filter: 1395189
   ->  Aggregate  (cost=160491.03..160491.04 rows=1 width=0) (actual time=1039.563..1039.563 rows=1 loops=1)
         ->  Seq Scan on t1 t1_1  (cost=0.00..160483.12 rows=3163 width=0) (actual time=901.577..1039.307 rows=2835 loops=1)
               Filter: ((NOT deleted) AND ((status)::text = '02'::text))
               Rows Removed by Filter: 1392354
 Planning time: 0.417 ms
 Execution time: 6251.024 ms
(11 rows)

ai=> select count(*) from t_ai_prd_item;                       
  count  
---------
 1395189
(1 row)

ai=> select count(*),status from t_ai_prd_item group by status;
  count  | status 
---------+--------
     364 | 04
      25 | 05
    2835 | 02
 1391965 | 06
(4 rows)

ai=>

分析发现,表1中有1395189条记录,status=’01’的记录为0,status=’02’的记录为2835条。

2 那么在status字段上建立一个btree index,效果会怎么样呢?

ai=> create index idx_status on t1(status);
CREATE INDEX
ai=> explain analyze select '01' status, count(1) from t1 where status = '01' and deleted = false 
ai-> union all 
ai-> select '02' status, count(1) from t1 where status = '02' and deleted = false;
                                                               QUERY PLAN                                                               
----------------------------------------------------------------------------------------------------------------------------------------
 Append  (cost=8.45..730.24 rows=2 width=40) (actual time=0.037..3.999 rows=2 loops=1)
   ->  Aggregate  (cost=8.45..8.46 rows=1 width=0) (actual time=0.036..0.036 rows=1 loops=1)
         ->  Index Scan using idx_status on t1  (cost=0.43..8.45 rows=1 width=0) (actual time=0.033..0.033 rows=0 loops=1)
               Index Cond: ((status)::text = '01'::text)
               Filter: (NOT deleted)
   ->  Aggregate  (cost=721.76..721.77 rows=1 width=0) (actual time=3.962..3.962 rows=1 loops=1)
         ->  Index Scan using idx_status on t1 t1_1  (cost=0.43..714.10 rows=3063 width=0) (actual time=0.029..3.673 rows=2835 loops=1)
               Index Cond: ((status)::text = '02'::text)
               Filter: (NOT deleted)
 Planning time: 0.291 ms
 Execution time: 4.067 ms
(11 rows)

ai=>

效果不错,但是结合到实际业务场景,此处只是针对status=’01’和status=’02’的情况来做统计。那么有没有更好的方法来解决这个场景呢?

3 创建1个partial index来测试

ai=> create index idx_partial on t1(status) where (status='01' or status='02');
CREATE INDEX
ai=> explain analyze select '01' status, count(1) from t1 where status = '01' and deleted = false 
ai-> union all 
ai-> select '02' status, count(1) from t1 where status = '02' and deleted = false;
                                                               QUERY PLAN                                                               
----------------------------------------------------------------------------------------------------------------------------------------
 Append  (cost=8.30..732.19 rows=2 width=40) (actual time=0.019..3.916 rows=2 loops=1)
   ->  Aggregate  (cost=8.30..8.31 rows=1 width=0) (actual time=0.018..0.018 rows=1 loops=1)
         ->  Index Scan using idx_partial on t1  (cost=0.28..8.30 rows=1 width=0) (actual time=0.015..0.015 rows=0 loops=1)
               Index Cond: ((status)::text = '01'::text)
               Filter: (NOT deleted)
   ->  Aggregate  (cost=723.85..723.86 rows=1 width=0) (actual time=3.897..3.897 rows=1 loops=1)
         ->  Index Scan using idx_partial on t1 t1_1  (cost=0.28..716.20 rows=3063 width=0) (actual time=0.030..3.599 rows=2835 loops=1)
               Index Cond: ((status)::text = '02'::text)
               Filter: (NOT deleted)
 Planning time: 0.234 ms
 Execution time: 3.992 ms
(11 rows)

ai=>

对比,发现SQL的执行效率几乎没有差别。但是:

ai=> \di+ idx_status 
                         List of relations
 Schema |    Name    | Type  | Owner | Table | Size  | Description 
--------+------------+-------+-------+-------+-------+-------------
 ai     | idx_status | index | ai    | t1    | 30 MB | 
(1 row)

ai=> \di+ idx_partial 
                         List of relations
 Schema |    Name     | Type  | Owner | Table | Size  | Description 
--------+-------------+-------+-------+-------+-------+-------------
 ai     | idx_partial | index | ai    | t1    | 80 kB | 
(1 row)

ai=>

4 小结:

在确保SQL执行效率的同时,这个partial index所占的存储空间是b-tree index的1/384,大大降低了存储空间的开销。

三 关于partial index

1 什么是partial index?

分区索引是基于表中部分数据建立的,被索引的部分数据是原数据的一个子集。这个子集数据是基于某些条件可以明确计算出来的。

2 partial index适用场景?

对于表中数据分布“不均匀”的场景,比如某些数据占据绝大多数,而其它一些数据只占少量,且要满足查询条件针是对那些小数据量的查询情形。此例正好满足这种情况,总数据量为140万左右,而状态为01和02的数据只占极少的比例,且查询是针对状态为01和02的查询。

通过partial index可以排除大量普通数据或业务上“不感兴趣”的数据。如:一个在线订单系统,可以针对那些不在经常访问的客户端IP范围之外的IP进行创建分区索引,或者针对已下单还未支付的订单进行分区索引的创建。这样,当查询那些不在常用IP范围内的订单,或者那些已下单未支付的订单信息时,可以保证查询效率。

3 partial index的优势?

由于其是针对部分数据进行索引,显然同传统b-tree索引相比,其所占磁盘空间将大大缩小。当重建维护这些分区索引时,速度也非常快。

4 参考

partial index官方文档地址:
https://www.postgresql.org/docs/9.3/static/indexes-partial.html

PostgreSQL中hash索引的小结

一 关于PostgreSQL中使用hash index的小结如下:

  1. 只适合于等值查询;
  2. 不受WAL-logged保护(pre-PG 10),如果数据库崩溃,则需要重建该类型索引;
  3. 索引上的改变不会经由streaming或file-based复制到备库;
  4. 不支持在多列上创建联合hash index;
  5. 通常,不建议使用hash index。

二 PostgreSQL中使用hash index导致的一则错误案例

 
### Error updating database.  Cause: org.postgresql.util.PSQLException: ERROR: could not read block 0 in file "base/82560/1801225": read only 0 of 8192 bytes
### The error may involve com.onlyou.platform.form.entity.FormDetailEntityMapper.updateByPrimaryKeySelective-Inline
### The error occurred while setting parameters
### SQL: UPDATE t_onlyou_form_detail SET form_id=?,label=?,base_type=?,is_show=?,sort=?,create_ts=?,create_user_id=?,update_ts=?,update_user_id=? WHERE (id=?)
### Cause: org.postgresql.util.PSQLException: ERROR: could not read block 0 in file "base/82560/1801225": read only 0 of 8192 bytes
; uncategorized SQLException for SQL []; SQL state [XX001]; error code [0]; ERROR: could not read block 0 in file "base/82560/1801225": read only 0 of 8192 bytes; nested exception is org.postgresql.util.PSQLException: ERROR: could not read block 0 in file "base/82560/1801225": read only 0 of 8192 bytes

原因是数据库配置了主备结构,并且期间执行过切换。在新的主库(原备库)上,发现了上述错误,经排查该表上有1个hash index,解决办法就是重建该hash index,或者改为其它类型的index。

三 小结

这是之前,一个项目在阿里云生产环境RDS上遇到的错误。

ERROR: could not read block 0 in file "base/82560/1801225": read only 0 of 8192 bytes;很有可能把我们指向错误的方向,误以为数据库存储是不是出问题,或者数据块上出现了错误?

监听日志过大导致数据库连接变慢

收到公司一项目组邮件,说某开发环境的数据库连接不稳定,时快时慢,但是一旦连上数据库,整体的操作并不慢,想让我帮忙看看。

环境:Windows 2K8 R2 64位操作系统+Oracle 11gR2 64 bit单实例数据库 。

现象:在数据库服务器上,tnsping本地机器上的Oracle网络服务名,果然时快时慢。快时延迟只有10毫秒或者是0毫秒,而慢时延迟能达到10000多毫秒。这个显然不能接受。

思路:

1 第1反映可能是Oracle网络配置问题;
2 数据库服务器或者监听进程过于繁忙导致的;

处理:

经过排查和分析,由于是开发环境,各种不知名的原因,导致该Windows服务器上安装了1套10g的数据库软件[未建库],1套文中提到的11gR2单实例数据库,10g和11g版本的环境分别创建了各自的监听程序,10g的在默认1521端口,11g的在1522端口,并且2个监听程序的名字都是listener。问题更为蹊跷的是,如果tnsping 10g软件下的网络服务名很正常,tnsping 11g软件下的网络服务名才会出现时快时慢的现象。

于是乎,停掉10g环境下的那个占用1521端口的监听,重新配置11g的监听使之驻留在1521端口上。此时问题依旧:

C:\Users\Administrator>tnsping orcl

TNS Ping Utility for 64-bit Windows: Version 11.2.0.1.0 - Production on 24-6月 -2014 16:49:20

Copyright (c) 1997, 2010, Oracle.  All rights reserved.

已使用的参数文件:
D:\app\Administrator\product\11.2.0\dbhome_1\network\admin\sqlnet.ora


已使用 TNSNAMES 适配器来解析别名
尝试连接 (DESCRIPTION = (ADDRESS_LIST = (ADDRESS = (PROTOCOL = TCP)(HOST = 172.168.1.87)(PORT = 1521))) (CONNECT_DATA = (SERVICE_NAME = orcl)))
OK (0 毫秒)

C:\Users\Administrator>tnsping orcl

TNS Ping Utility for 64-bit Windows: Version 11.2.0.1.0 - Production on 24-6月 -2014 16:49:22

Copyright (c) 1997, 2010, Oracle.  All rights reserved.

已使用的参数文件:
D:\app\Administrator\product\11.2.0\dbhome_1\network\admin\sqlnet.ora


已使用 TNSNAMES 适配器来解析别名
尝试连接 (DESCRIPTION = (ADDRESS_LIST = (ADDRESS = (PROTOCOL = TCP)(HOST = 172.168.1.87)(PORT = 1521))) (CONNECT_DATA = (SERVICE_NAME = orcl)))
OK (7360 毫秒)

C:\Users\Administrator>

说明问题应该不至于出现在网络配置上面。

同时,该库是一个开发用的数据库,更谈不上繁忙之说。

那么,问题究竟应该出现在那儿呢?既然,在服务器上tnsping本地机器上的网络服务名不稳定,且SQL*PLUS通过网络服务名来访问本地机器上的Oracle服务肯定也会慢,那么就发起一个本地的网络服务连接,然后看看监听的日志信息。果不其然,发现了一点儿端倪,监听程序的日志文件过大:

listener_log_4GB

listener_log_4GB

原来,造成问题的罪魁就是这个过大的日志文件[Windows下Oracle的监听日志文件超过4G大小,便会出现该问题]!解决的方法就很简单,停止监听程序,删除监听日志文件,重启监听,问题解决!

谨慎细致的德国客户同事

这次,在德国出差期间,不巧的是,干活儿的家伙什蓝屏罢工了。向德国客户求助,德国人原本想帮我重新安装个正版的Windows系统,但想想,不对劲,友好的说,到时候你还是要把这个正版的软件带回China。

所以,作罢。

然后,德国佬给我提供了一台式机,并帮我做了些基本配置。开机,进入桌面之后,瞬间就觉得人家德国人做事的贴心与细致了:

dbs

原来,这哥们儿深知我干的是数据库相关的活儿,所以就事先在桌面上帮我创建好了访问数据库服务器远程桌面的快捷方式。

瞬间,觉得温暖。

Windows 10gR2 RAC迁移OCR和Vote Disk以及ASM磁盘组上的数据

概要:本文详细记录如何把运行在Windows 2K8环境上的Oracle 10gR2 双节点RAC数据库的OCR、Vote Disk以及存放在ASM磁盘组里的数据,迁移至新存储的步骤。

迁移之前的存储信息:

wps_clip_image-4627

如上图所示,我们的最终目标是要把OCR、Vote Disk,DATA、FLASH磁盘组从Disk 2,Disk 3上分别迁移至Disk 4和Disk 5。

接下来给出详细的操作步骤和流程:

1  迁移OCR

A 创建磁盘分区

C:\Users\Administrator>diskpart

Microsoft DiskPart version 6.1.7601

Copyright (C) 1999-2008 Microsoft Corporation.

On computer: HAMNODE1

DISKPART> list disk

Disk ###  Status         Size     Free     Dyn  Gpt

--------  -------------  -------  -------  ---  ---

Disk 0    Online           40 GB      0 B

Disk 1    Online           20 GB    19 GB

Disk 2    Online         6149 MB  2048 KB

Disk 3    Online         6149 MB  2048 KB

Disk 4    Online         6149 MB  6147 MB

Disk 5    Online           10 GB    10 GB

DISKPART> select disk 4

Disk 4 is now the selected disk.

DISKPART> list part

There are no partitions on this disk to show.

DISKPART> create part ext

DiskPart succeeded in creating the specified partition.

DISKPART> create part log size=320

DiskPart succeeded in creating the specified partition.

DISKPART> create part log

DiskPart succeeded in creating the specified partition.

DISKPART> list part

Partition ###  Type              Size     Offset

-------------  ----------------  -------  -------

Partition 0    Extended          6147 MB  1024 KB

Partition 1    Logical            320 MB  2048 KB

* Partition 2    Logical           5825 MB   323 MB

DISKPART>

分区之后:

wps_clip_image-12024

注:您应该在其他节点上看到同样的磁盘分区信息。且,建议在其他节点上将Windows系统自动给新分区分配的盘符移除掉。

B 准备磁盘,创建裸设备链接

C:\oracle\product\10.2.0\crs\BIN\GUIOracleOBJManager.exe

wps_clip_image-12115

wps_clip_image-24325

wps_clip_image-17645

wps_clip_image-13996

同样,执行完上述操作,您应该在RAC的所有节点上通过

C:\oracle\product\10.2.0\crs\BIN\GUIOracleOBJManager.exe程序看到相同的信息。

C 手工备份OCR

ocrconfig -export c:\oracle…..\backup_filename

备份之前,可以查看下OCR的自动备份信息:

c:\oracle\product\10.2.0\crs\BIN>ocrconfig -showbackup

hamnode2     2014/05/08 06:01:07     C:\oracle\product\10.2.0\crs\cdata\crs

hamnode2     2014/05/07 23:44:04     C:\oracle\product\10.2.0\crs\cdata\crs

hamnode2     2014/05/07 19:44:04     C:\oracle\product\10.2.0\crs\cdata\crs

hamnode2     2014/05/06 16:34:35     C:\oracle\product\10.2.0\crs\cdata\crs

hamnode1     2014/04/30 07:09:51     C:\oracle\product\10.2.0\crs\cdata\crs

c:\oracle\product\10.2.0\crs\BIN>

执行备份:

c:\oracle\product\10.2.0\crs\BIN>ocrconfig -export C:\oracle\product\10.2.0\crs\cdata\crs\backup_ocr_140508.bak

c:\oracle\product\10.2.0\crs\BIN>cd ..\cdata\crs

c:\oracle\product\10.2.0\crs\cdata\crs>dir

Volume in drive C has no label.

Volume Serial Number is BA2B-5F59

Directory of c:\oracle\product\10.2.0\crs\cdata\crs

05/08/2014  07:50 AM    <DIR>          .

05/08/2014  07:50 AM    <DIR>          ..

05/06/2014  03:24 AM         4,063,232 backup00.ocr

05/05/2014  11:24 PM         4,063,232 backup01.ocr

05/05/2014  07:24 PM         4,063,232 backup02.ocr

05/08/2014  07:43 AM            94,029 backup_ocr_140508.bak

05/02/2014  06:23 AM         4,042,752 day.ocr

05/05/2014  03:24 PM         4,063,232 day_.ocr

05/02/2014  01:04 AM            93,359 hw_backup_ocr.bak

04/30/2014  07:09 AM         4,042,752 week.ocr

8 File(s)     24,525,820 bytes

2 Dir(s)  20,506,509,312 bytes free

c:\oracle\product\10.2.0\crs\cdata\crs>

D 添加OCR镜像

ocrconfig -replace ocrmirror \\.\ocrmirror

添加之前,查看OCR信息:

c:\oracle\product\10.2.0\crs\BIN>ocrcheck

Status of Oracle Cluster Registry is as follows :

Version                  :          2

Total space (kbytes)     :     327452

Used space (kbytes)      :       3836

Available space (kbytes) :     323616

ID                       :  478679697

Device/File Name         : \\.\ocrcfg

Device/File integrity check succeeded

Device/File not configured

Cluster registry integrity check succeeded

c:\oracle\product\10.2.0\crs\BIN>

添加OCRMIRROR并验证:

c:\oracle\product\10.2.0\crs\BIN>ocrconfig -replace ocrmirror \\.\ocrmirror

c:\oracle\product\10.2.0\crs\BIN>ocrcheck

Status of Oracle Cluster Registry is as follows :

Version                  :          2

Total space (kbytes)     :     327452

Used space (kbytes)      :       3836

Available space (kbytes) :     323616

ID                       :  478679697

Device/File Name         : \\.\ocrcfg

Device/File integrity check succeeded

Device/File Name         : \\.\ocrmirror

Device/File integrity check succeeded

Cluster registry integrity check succeeded

c:\oracle\product\10.2.0\crs\BIN>

E 删除OCR device并验证

c:\oracle\product\10.2.0\crs\BIN>ocrconfig -replace ocr

c:\oracle\product\10.2.0\crs\BIN>ocrcheck

Status of Oracle Cluster Registry is as follows :

Version                  :          2

Total space (kbytes)     :     327452

Used space (kbytes)      :       3836

Available space (kbytes) :     323616

ID                       :  478679697

Device/File Name         : \\.\ocrmirror

Device/File integrity check succeeded

Device/File not configured

Cluster registry integrity check succeeded

c:\oracle\product\10.2.0\crs\BIN>

F 重启CRS并验证

至此,我们通过给OCR添加1份镜像然后删除原主OCR的方式,完成对OCR的迁移。

注:通过这种方式,删除原OCR之后,新添加的OCR镜像自动成为主OCR。

2 迁移Vote Disk

A 创建磁盘分区

这里的创建磁盘分区如创建OCR磁盘分区时,方法一致:

C:\Users\Administrator>diskpart

Microsoft DiskPart version 6.1.7601

Copyright (C) 1999-2008 Microsoft Corporation.

On computer: HAMNODE1

DISKPART> list disk

Disk ###  Status         Size     Free     Dyn  Gpt

--------  -------------  -------  -------  ---  ---

Disk 0    Online           40 GB      0 B

Disk 1    Online           20 GB    19 GB

Disk 2    Online         6149 MB  2048 KB

Disk 3    Online         6149 MB  2048 KB

Disk 4    Online         6149 MB  2048 KB

Disk 5    Online           10 GB    10 GB

DISKPART> select disk 5

Disk 5 is now the selected disk.

DISKPART> list part

There are no partitions on this disk to show.

DISKPART> create part ext

DiskPart succeeded in creating the specified partition.

DISKPART> create part log size=196

DiskPart succeeded in creating the specified partition.

DISKPART> create part log

DiskPart succeeded in creating the specified partition.

DISKPART> list part

Partition ###  Type              Size     Offset

-------------  ----------------  -------  -------

Partition 0    Extended            10 GB  1024 KB

Partition 1    Logical            196 MB  2048 KB

* Partition 2    Logical              9 GB   199 MB

DISKPART>

分区之后的信息:

wps_clip_image-12445

注:您应该在其他节点上看到同样的磁盘分区信息。且,建议在其他节点上将Windows系统自动给新分区分配的盘符移除掉。

B 准备磁盘,创建裸设备链接

这里的创建磁盘分区如创建OCR磁盘分区时,方法一致:

C:\oracle\product\10.2.0\crs\BIN\GUIOracleOBJManager.exe

wps_clip_image-12507

wps_clip_image-3414

C 查看Vote Disk信息

c:\oracle\product\10.2.0\crs\BIN>crsctl query css votedisk

0.     0    \\.\votedsk1

located 1 votedisk(s).

c:\oracle\product\10.2.0\crs\BIN>

D 备份Vote Disk

c:\oracle\product\10.2.0\crs\BIN>ocopy \\.\votedsk1 c:\oracle\product\10.2.0\crs\cdata\crs\votedisk_140508.bak

C:\ORACLE\PRODUCT\10.2.0\CRS\CDATA\CRS\VOTEDISK_140508.BAK

c:\oracle\product\10.2.0\crs\BIN>cd ..\cdata\crs

c:\oracle\product\10.2.0\crs\cdata\crs>dir

Volume in drive C has no label.

Volume Serial Number is BA2B-5F59

Directory of c:\oracle\product\10.2.0\crs\cdata\crs

05/08/2014  08:37 AM    <DIR>          .

05/08/2014  08:37 AM    <DIR>          ..

05/06/2014  03:24 AM         4,063,232 backup00.ocr

05/05/2014  11:24 PM         4,063,232 backup01.ocr

05/05/2014  07:24 PM         4,063,232 backup02.ocr

05/08/2014  07:43 AM            94,029 backup_ocr_140508.bak

05/02/2014  06:23 AM         4,042,752 day.ocr

05/05/2014  03:24 PM         4,063,232 day_.ocr

05/02/2014  01:04 AM            93,359 hw_backup_ocr.bak

05/08/2014  08:37 AM       205,520,896 VOTEDISK_140508.BAK

04/30/2014  07:09 AM         4,042,752 week.ocr

9 File(s)    230,046,716 bytes

2 Dir(s)  20,299,304,960 bytes free

c:\oracle\product\10.2.0\crs\cdata\crs>

E 停止CRS

c:\oracle\product\10.2.0\crs\BIN>srvctl stop database -d hamrac

c:\oracle\product\10.2.0\crs\BIN>srvctl stop asm -n hamnode1

c:\oracle\product\10.2.0\crs\BIN>srvctl stop asm -n hamnode2

c:\oracle\product\10.2.0\crs\BIN>srvctl stop nodeapps -n hamnode2

c:\oracle\product\10.2.0\crs\BIN>srvctl stop nodeapps -n hamnode1

c:\oracle\product\10.2.0\crs\BIN>crs_stat -t

Name           Type           Target    State     Host

------------------------------------------------------------

ora....SM1.asm application    OFFLINE   OFFLINE

ora....E1.lsnr application    OFFLINE   OFFLINE

ora....de1.gsd application    OFFLINE   OFFLINE

ora....de1.ons application    OFFLINE   OFFLINE

ora....de1.vip application    OFFLINE   OFFLINE

ora....SM2.asm application    OFFLINE   OFFLINE

ora....E2.lsnr application    OFFLINE   OFFLINE

ora....de2.gsd application    OFFLINE   OFFLINE

ora....de2.ons application    OFFLINE   OFFLINE

ora....de2.vip application    OFFLINE   OFFLINE

ora.hamrac.db  application    OFFLINE   OFFLINE

ora....c1.inst application    OFFLINE   OFFLINE

ora....c2.inst application    OFFLINE   OFFLINE

c:\oracle\product\10.2.0\crs\BIN>crsctl stop crs

Stopping resources. This could take several minutes.

Successfully stopped CRS resources.

Stopping CSSD.

Shutting down CSS daemon.

Shutdown request successfully issued.

c:\oracle\product\10.2.0\crs\BIN>

注:最后一步停止CRS时,您需要到RAC所有节点上都停止CRS!

F 添加Vote Disk

c:\oracle\product\10.2.0\crs\BIN>crsctl add css votedisk \\.\votedsk2 -force

Now formatting voting disk: \\.\votedsk2

successful addition of votedisk \\.\votedsk2.

c:\oracle\product\10.2.0\crs\BIN>crsctl query css votedisk

0.     0    \\.\votedsk1

1.     0    \\.\votedsk2

located 2 votedisk(s).

c:\oracle\product\10.2.0\crs\BIN>

G 删除原Vote Disk

c:\oracle\product\10.2.0\crs\BIN>crsctl delete css votedisk \\.\votedsk1 -force

successful deletion of votedisk \\.\votedsk1.

c:\oracle\product\10.2.0\crs\BIN>crsctl query css votedisk

0.     0    \\.\votedsk2

located 1 votedisk(s).

c:\oracle\product\10.2.0\crs\BIN>

H 启动CRS并验证

3 迁移ASM DATA磁盘组

A 查看ASM磁盘信息

C:\Users\Administrator>asmtool -list

NTFS                             \Device\Harddisk0\Partition1              100M

NTFS                             \Device\Harddisk0\Partition2            40858M

Oracle Raw Device file           \Device\Harddisk2\Partition1              320M

ORCLDISKDATA1                    \Device\Harddisk2\Partition2             5825M

Oracle Raw Device file           \Device\Harddisk3\Partition1              196M

ORCLDISKFRA0                     \Device\Harddisk3\Partition2             5949M

Oracle Raw Device file           \Device\Harddisk4\Partition1              320M

\Device\Harddisk4\Partition2             5825M

Oracle Raw Device file           \Device\Harddisk5\Partition1              196M

\Device\Harddisk5\Partition2            10044M

C:\Users\Administrator>set oracle_sid=+asm1

C:\Users\Administrator>sqlplus / as sysdba

SQL*Plus: Release 10.2.0.5.0 - Production on Fri May 9 01:57:46 2014

Copyright (c) 1982, 2010, Oracle.  All Rights Reserved.

Connected to:

Oracle Database 10g Enterprise Edition Release 10.2.0.5.0 - 64bit Production

With the Partitioning, Real Application Clusters, OLAP, Data Mining

and Real Application Testing options

SQL> col path for a30

SQL> set line 120

SQL> select name,state,total_mb,free_mb,path from v$asm_disk;

NAME                           STATE      TOTAL_MB    FREE_MB PATH

------------------------------ -------- ---------- ---------- ------------------------------

DATA_0001                      NORMAL         5825       4215 \\.\ORCLDISKDATA1

FRA_0000                       NORMAL         5949       5667 \\.\ORCLDISKFRA0

SQL> select name,state,total_mb,free_mb from v$asm_diskgroup;

NAME                           STATE         TOTAL_MB    FREE_MB

------------------------------ ----------- ---------- ----------

DATA                           MOUNTED           5825       4215

FRA                            MOUNTED           5949       5667

SQL>

结合上述,看到DATA磁盘组[目前只有1个ASM磁盘,DATA_0001]对应于\Device\Harddisk2\Partition2设备。

FRA磁盘组[目前也只有1个ASM磁盘,FRA_0000]对应于\Device\Harddisk3\Partition2。

B DATA磁盘组添加磁盘

wps_clip_image-12595

wps_clip_image-31477

wps_clip_image-22238

wps_clip_image-12359

wps_clip_image-21133

wps_clip_image-15974

wps_clip_image-10317

SQL> select name,state,total_mb,free_mb from v$asm_diskgroup;

NAME                           STATE         TOTAL_MB    FREE_MB

------------------------------ ----------- ---------- ----------

DATA                           MOUNTED          11650      10038

FRA                            MOUNTED           5949       5667

SQL> select name,state,total_mb,free_mb,path from v$asm_disk;

NAME                           STATE      TOTAL_MB    FREE_MB PATH

------------------------------ -------- ---------- ---------- ------------------

DATA_0001                      NORMAL         5825       5019 \\.\ORCLDISKDATA1

FRA_0000                       NORMAL         5949       5667 \\.\ORCLDISKFRA0

DATA_0000                      NORMAL         5825       5019 \\.\ORCLDISKDATA0

SQL>

C DATA磁盘组移除旧磁盘

SQL> alter diskgroup data drop disk data_0001;

Diskgroup altered.

SQL> select name,state,total_mb,free_mb,path from v$asm_disk;

NAME                           STATE      TOTAL_MB    FREE_MB PATH

------------------------------ -------- ---------- ---------- ------------------------------

DATA_0001                      DROPPING       5825       5186 \\.\ORCLDISKDATA1

FRA_0000                       NORMAL         5949       5667 \\.\ORCLDISKFRA0

DATA_0000                      NORMAL         5825       4852 \\.\ORCLDISKDATA0

SQL> select name,state,total_mb,free_mb from v$asm_diskgroup;

NAME                           STATE         TOTAL_MB    FREE_MB

------------------------------ ----------- ---------- ----------

DATA                           MOUNTED          11650      10038

FRA                            MOUNTED           5949       5667

SQL> select * from v$asm_operation;

GROUP_NUMBER OPERA STAT      POWER     ACTUAL      SOFAR   EST_WORK   EST_RATE EST_MINUTES

------------ ----- ---- ---------- ---------- ---------- ---------- ---------- -----------

1 REBAL RUN           1          1        776        808       1451           0

SQL>

直到最后:

SQL> select * from v$asm_operation;

no rows selected

SQL> select name,state,total_mb,free_mb from v$asm_diskgroup;

NAME                           STATE         TOTAL_MB    FREE_MB

------------------------------ ----------- ---------- ----------

DATA                           MOUNTED           5825       4215

FRA                            MOUNTED           5949       5667

SQL> select name,state,total_mb,free_mb,path from v$asm_disk;

NAME                           STATE      TOTAL_MB    FREE_MB PATH

------------------------------ -------- ---------- ---------- --------------------

NORMAL         5825          0 \\.\ORCLDISKDATA1

FRA_0000                       NORMAL         5949       5667 \\.\ORCLDISKFRA0

DATA_0000                      NORMAL         5825       4215 \\.\ORCLDISKDATA0

SQL>

4 迁移ASM FRA磁盘组

A FRA磁盘组添加新磁盘

wps_clip_image-12791

wps_clip_image-4041

wps_clip_image-21263

SQL> select name,state,total_mb,free_mb,path from v$asm_disk;

NAME                           STATE      TOTAL_MB    FREE_MB PATH

------------------------------ -------- ---------- ---------- --------------------

NORMAL         5825          0 \\.\ORCLDISKDATA1

FRA_0000                       NORMAL         5949       5842 \\.\ORCLDISKFRA0

DATA_0000                      NORMAL         5825       4215 \\.\ORCLDISKDATA0

FRA_0001                       NORMAL        10044       9867 \\.\ORCLDISKFRA1

SQL> select name,state,total_mb,free_mb from v$asm_diskgroup;

NAME                           STATE         TOTAL_MB    FREE_MB

------------------------------ ----------- ---------- ----------

DATA                           MOUNTED           5825       4215

FRA                            MOUNTED          15993      15709

SQL>

B FRA磁盘组删除旧磁盘

SQL> alter diskgroup fra drop disk fra_0000;

Diskgroup altered.

SQL> select name,state,total_mb,free_mb from v$asm_diskgroup;

NAME                           STATE         TOTAL_MB    FREE_MB

------------------------------ ----------- ---------- ----------

DATA                           MOUNTED           5825       4215

FRA                            MOUNTED          15993      15709

SQL> select name,state,total_mb,free_mb,path from v$asm_disk;

NAME                           STATE      TOTAL_MB    FREE_MB PATH

------------------------------ -------- ---------- ---------- ------------------

NORMAL         5825          0 \\.\ORCLDISKDATA1

FRA_0000                       DROPPING       5949       5920 \\.\ORCLDISKFRA0

DATA_0000                      NORMAL         5825       4215 \\.\ORCLDISKDATA0

FRA_0001                       NORMAL        10044       9789 \\.\ORCLDISKFRA1

SQL> select * from v$asm_operation;

no rows selected

SQL> select name,state,total_mb,free_mb,path from v$asm_disk;

NAME                           STATE      TOTAL_MB    FREE_MB PATH

------------------------------ -------- ---------- ---------- ------------------

NORMAL         5825          0 \\.\ORCLDISKDATA1

NORMAL         5949          0 \\.\ORCLDISKFRA0

DATA_0000                      NORMAL         5825       4215 \\.\ORCLDISKDATA0

FRA_0001                       NORMAL        10044       9762 \\.\ORCLDISKFRA1

SQL> select name,state,total_mb,free_mb from v$asm_diskgroup;

NAME                           STATE         TOTAL_MB    FREE_MB

------------------------------ ----------- ---------- ----------

DATA                           MOUNTED           5825       4215

FRA                            MOUNTED          10044       9762

SQL>

其他具体操作步骤类似。

5 删除磁盘分区

删除卷、磁盘分区信息之后:

wps_clip_image-19324

最终,对于OCR、Vote Disk的数据,我们分别通过添加镜像的方式,然后删除现有的配置,进而间接的将OCR、Vote Disk分别从Disk 2、Disk 3迁移到Disk 4和Disk 5。

对于存放在ASM 磁盘的DATA和FRA中的数据,我们是通过先对现有DATA、FRA 磁盘组分别添加ASM磁盘,然后删除磁盘组中原有的旧ASM磁盘,进而完成迁移ASM 磁盘数据的目标!

6 注意事项

1 Note:

Note:

You can migrate the RAC OCR when CRS is running ,but you cannot migrate the Voting Disk when the CRS is running.That means we must stop the CRS before we can migrate the Voting Disk.

2 Note:

Also,you must backup the voting disk when the CRS is running,or else if you shutdown the CRS first,and then you cannot use the ocopy command to backup the voting disk.

3 Note:

PROT-22: Storage too small

wps_clip_image-21036

Cause:

The ocrmirror disk space is less than the ocr disk space.

wps_clip_image-2601

Solution:

Enlarge the ocrmirror disk space as the same as the ocr disk space.

4 Note:

PROT-21: Invalid parameter

wps_clip_image-27194

Cause:

PROT-21 error is encountered because the cluster is not yet fully aware of the newly created logical drive that is being specified for <filename> in the ocrconfig -replace command.

Solution:[Doc ID 1059663.1]

This code defect is fixed in patch bundle 31 (and higher) for Oracle on Windows.
Patch 31 is available for download from My Oracle Support under the following patch numbers:

Microsoft Windows (32-bit) – 9233830
Microsoft Windows Itanium (64-bit) – 9233831
Microsoft Windows x64 (64-bit) – 9233832

There is also a relatively simple workaround available.  Namely, stop and restart the Oracle Object Service after creating the symbolic link for the new logical drive and before running the ‘ocrconfig -replace’ command.