索引扫描路径之3:Index Skip Scan

Index_Skip_Scan

在前面的两篇中,分别描述了Index Unique ScanIndex Range Scan,今天来描述Index Skip Scan。

 所谓的Index Skip Scan就是指,查询的WHERE条件中“SKIP”【跳过,没带上】了复合索引的前导列,只是指定了复合索引的其它列,这样CBO选择Index Skip Scan的路径来访问数据的方式。

如果复合索引的前导列唯一值越少(选择性低),非前导列索引唯一值越多(选择性高),则Index Skip Scan的性能越优。

事实上,在处理的过程中,Oracle将该复合索引上分为若干个logical subindexes(逻辑子索引),逻辑子索引的具体个数取决于前导列的唯一值值个数,即前导列有几个重复值就分为几个逻辑子索引。

Index Skip Scan适用的场景:

1 Index一定是一个复合索引(索引类型可以是UNIQUE的唯一索引,也可以是NONUIQUE的非唯一索引);
2 且复合索引的前导列重复值很多(即唯一值少),非前导列的重复值很少(唯一值多);
3 WHERE限制条件中,并没有带上该符合索引的前导列,仅仅是使用非前导列来过滤数据;

测试与验证:

1 创建测试表:

SQL> conn hr/hr
Connected.
SQL> create table skip_t as select object_id,object_name,object_type from all_objects;

Table created.

SQL> select count(*) from skip_t;

  COUNT(*)
----------
     55683

SQL> select count(distinct object_type) from skip_t;

COUNT(DISTINCTOBJECT_TYPE)
--------------------------
                        25

SQL> select count(distinct object_id) from skip_t;

COUNT(DISTINCTOBJECT_ID)
------------------------
                   55683

SQL> select count(distinct object_name) from skip_t;

COUNT(DISTINCTOBJECT_NAME)
--------------------------
                     30902

SQL>

从上,看到skip_t表数据情况:有55683条记录,且OBJECT_ID字段均唯一,无重复值。OBJECT_TYPE唯一值只有25个。
2 接下来,在OBJECT_TYPE和OBJECT_ID字段上创建复合索引,并收集统计信息:

SQL> create index idx_skip_t on skip_t(object_type,object_id);

Index created.

SQL> exec dbms_stats.gather_table_stats(ownname=>user,tabname=>'skip_t',cascade=>true);

PL/SQL procedure successfully completed.

SQL>

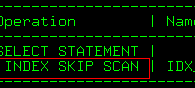
3 “Skip”掉复合索引前导列的情况,即让CBO按照预期的选择Index Skip Scan的路径来访问数据:

SQL> set autotrace trace
SQL> select object_type,object_id from skip_t where object_id=30000;

Execution Plan
----------------------------------------------------------
Plan hash value: 2119292092

-------------------------------------------------------------------------------
| Id  | Operation        | Name       | Rows  | Bytes | Cost (%CPU)| Time     |
-------------------------------------------------------------------------------
|   0 | SELECT STATEMENT |            |     1 |    15 |    26   (0)| 00:00:01 |
|*  1 |  INDEX SKIP SCAN | IDX_SKIP_T |     1 |    15 |    26   (0)| 00:00:01 |
-------------------------------------------------------------------------------

Predicate Information (identified by operation id):
---------------------------------------------------

   1 - access("OBJECT_ID"=30000)
       filter("OBJECT_ID"=30000)

Statistics
----------------------------------------------------------
          1  recursive calls
          0  db block gets
         14  consistent gets
          0  physical reads
          0  redo size
        611  bytes sent via SQL*Net to client
        524  bytes received via SQL*Net from client
          2  SQL*Net roundtrips to/from client
          0  sorts (memory)
          0  sorts (disk)
          1  rows processed

SQL> select object_type,object_name from skip_t where object_id=30000;

Execution Plan
----------------------------------------------------------
Plan hash value: 1237951313

------------------------------------------------------------------------------------------
| Id  | Operation                   | Name       | Rows  | Bytes | Cost (%CPU)| Time     |
------------------------------------------------------------------------------------------
|   0 | SELECT STATEMENT            |            |     1 |    40 |    27   (0)| 00:00:01 |
|   1 |  TABLE ACCESS BY INDEX ROWID| SKIP_T     |     1 |    40 |    27   (0)| 00:00:01 |
|*  2 |   INDEX SKIP SCAN           | IDX_SKIP_T |     1 |       |    26   (0)| 00:00:01 |
------------------------------------------------------------------------------------------

Predicate Information (identified by operation id):
---------------------------------------------------

   2 - access("OBJECT_ID"=30000)
       filter("OBJECT_ID"=30000)

Statistics
----------------------------------------------------------
          0  recursive calls
          0  db block gets
         15  consistent gets
          0  physical reads
          0  redo size
        640  bytes sent via SQL*Net to client
        524  bytes received via SQL*Net from client
          2  SQL*Net roundtrips to/from client
          0  sorts (memory)
          0  sorts (disk)
          1  rows processed

SQL>

4 使用索引前导列的情况:

SQL> select object_type,object_id from skip_t where object_type='TABLE';

136 rows selected.

Execution Plan
----------------------------------------------------------
Plan hash value: 3840590361

-------------------------------------------------------------------------------
| Id  | Operation        | Name       | Rows  | Bytes | Cost (%CPU)| Time     |
-------------------------------------------------------------------------------
|   0 | SELECT STATEMENT |            |  2227 | 33405 |     9   (0)| 00:00:01 |
|*  1 |  INDEX RANGE SCAN| IDX_SKIP_T |  2227 | 33405 |     9   (0)| 00:00:01 |
-------------------------------------------------------------------------------

Predicate Information (identified by operation id):
---------------------------------------------------

   1 - access("OBJECT_TYPE"='TABLE')

Statistics
----------------------------------------------------------
          1  recursive calls
          0  db block gets
         12  consistent gets
          0  physical reads
          0  redo size
       3592  bytes sent via SQL*Net to client
        623  bytes received via SQL*Net from client
         11  SQL*Net roundtrips to/from client
          0  sorts (memory)
          0  sorts (disk)
        136  rows processed

SQL> select object_type,object_name from skip_t where object_type='TABLE';

136 rows selected.

Execution Plan
----------------------------------------------------------
Plan hash value: 1483414757

------------------------------------------------------------------------------------------
| Id  | Operation                   | Name       | Rows  | Bytes | Cost (%CPU)| Time     |
------------------------------------------------------------------------------------------
|   0 | SELECT STATEMENT            |            |  2227 | 80172 |    43   (0)| 00:00:01 |
|   1 |  TABLE ACCESS BY INDEX ROWID| SKIP_T     |  2227 | 80172 |    43   (0)| 00:00:01 |
|*  2 |   INDEX RANGE SCAN          | IDX_SKIP_T |  2227 |       |     9   (0)| 00:00:01 |
------------------------------------------------------------------------------------------

Predicate Information (identified by operation id):
---------------------------------------------------

   2 - access("OBJECT_TYPE"='TABLE')

Statistics
----------------------------------------------------------
          0  recursive calls
          0  db block gets
         40  consistent gets
          0  physical reads
          0  redo size
       6671  bytes sent via SQL*Net to client
        623  bytes received via SQL*Net from client
         11  SQL*Net roundtrips to/from client
          0  sorts (memory)
          0  sorts (disk)
        136  rows processed

SQL>

遭遇ORA-17410及ORA-03137:TTC协议内部错误:[12333]

早上,项目组同事发过来一则应用系统连接数据库错误的请求技术支持,具体信息可见下述报错截图:

ora-17410

ora-17410

这则错误信息对于我还真是大姑娘上轿–头一回遇到。下面简单记录下处理错误的思路和方法:

环境说明:一套Linux X86_64位环境的Oracle 11gR2【11.2.0.1.0】的单实例数据库。应用系统通过调用Tomcat的JDBC驱动来访问数据,如下:

OS:

[oracle@oracle11g ~]$ uname -rm
2.6.18-194.el5 x86_64
[oracle@oracle11g ~]$

数据库:

SQL> select * from v$version;

BANNER
--------------------------------------------------------------------------------
Oracle Database 11g Enterprise Edition Release 11.2.0.1.0 - 64bit Production
PL/SQL Release 11.2.0.1.0 - Production
CORE    11.2.0.1.0      Production
TNS for Linux: Version 11.2.0.1.0 - Production
NLSRTL Version 11.2.0.1.0 - Production

SQL>

同事说,上周五的时候,通过登录应用系统来访问数据库还一切正常,今天早上登录系统就报上述错误,更加觉得蹊跷。

1 首先,让同事登录应用系统,重现错误。然后查看alert日志文件,看到下述错误信息的线索:

Mon Sep 16 09:43:24 2013
Errors in file /u01/app/oracle/diag/rdbms/glndb/GLNDB/trace/GLNDB_ora_11692.trc  (incident=78959):
ORA-03137: TTC 协议内部错误: [12333] [6] [88] [77] [] [] [] []
Incident details in: /u01/app/oracle/diag/rdbms/glndb/GLNDB/incident/incdir_78959/GLNDB_ora_11692_i78959.trc
Mon Sep 16 09:43:27 2013
Trace dumping is performing id=[cdmp_20130916094327]
Mon Sep 16 09:43:28 2013
Sweep [inc][78959]: completed
Sweep [inc2][78959]: completed

2 根据alert日志提示,继续查看/u01/app/oracle/diag/rdbms/glndb/GLNDB/trace/GLNDB_ora_11692.trc文件,看到:

*** 2013-09-16 09:43:24.912
*** SESSION ID:(410.54431) 2013-09-16 09:43:24.912
*** CLIENT ID:() 2013-09-16 09:43:24.912
*** SERVICE NAME:(SYS$USERS) 2013-09-16 09:43:24.912
*** MODULE NAME:(JDBC Thin Client) 2013-09-16 09:43:24.912
*** ACTION NAME:() 2013-09-16 09:43:24.912

--- PROTOCOL VIOLATION DETECTED ---
...
...
...
  NamespaceDump:  
            Child Cursor:  Heap0=0x9fae5148 Heap6=0xb8bc6b48 Heap0 
Load Time=09-16-2013 09:43:24 Heap6 Load Time=09-16-2013 09:43:24 
  NamespaceDump:  
    Parent Cursor:  sql_id=4x3cjtfs37n4v parent=0xb21328e8 maxchild=5 plk=y ppn=n 
      Current Cursor Sharing Diagnostics Nodes:  
        Child Node: 3  ID=40 reason=Bind mismatch(33) size=2x4 
          init ranges in first pass: 1 
          selectivity: 0 
        Child Node: 2  ID=37 reason=Authorization Check failed(4) size=5x4 
          translation table position: 0 
          original handle: 3055622408 
          temp handle: 2705674440 
          schema: 161 
          synonym object number: 0 
        Child Node: 1  ID=3 reason=Optimizer mismatch(13) size=3x4 
          kxscflg: 32 
          kxscfl4: 4194560 
          dnum_kksfcxe: 1 
      Aged Out Cursor Sharing Diagnostic Nodes:  
        Child Node: 3  ID=37 reason=Authorization Check failed(4) size=5x4 
          translation table position: 0 
          original handle: 2705674440 
          temp handle: 3055622408 
          schema: 160 
          synonym object number: 0 
        Child Node: 2  ID=40 reason=Bind mismatch(25) size=0x0 
          extended cursor sharing:   
        Child Node: 1  ID=3 reason=Optimizer mismatch(13) size=3x4 
          kxscflg: 32 
          kxscfl4: 4194560 
          dnum_kksfcxe: 1 
        Child Node: 0  ID=37 reason=Authorization Check failed(4) size=5x4 
          translation table position: 0 
          original handle: 3055622408 
          temp handle: 2705674440 
          schema: 161 
          synonym object number: 0 
        Child Node: 0  ID=3 reason=Optimizer mismatch(13) size=3x4 
          kxscflg: 32 
          kxscfl4: 4194560 
          dnum_kksfcxe: 0 
        Child Node: 3  ID=37 reason=Authorization Check failed(4) size=5x4 
          translation table position: 0 
          original handle: 3055622408 
          temp handle: 2705674440 
          schema: 161 
          synonym object number: 0 
        Child Node: 2  ID=3 reason=Optimizer mismatch(13) size=3x4 
          kxscflg: 32 
          kxscfl4: 4194560 
          dnum_kksfcxe: 2 
        Child Node: 1  ID=37 reason=Authorization Check failed(4) size=5x4 
          translation table position: 0 
          original handle: 2705674440 
          temp handle: 3055622408 
          schema: 160 
          synonym object number: 0 
        Child Node: 0  ID=3 reason=Optimizer mismatch(13) size=3x4 
          kxscflg: 32 
          kxscfl4: 4194560 
          dnum_kksfcxe: 0 
        Child Node: 0  ID=3 reason=Optimizer mismatch(13) size=3x4 
          kxscflg: 32 
          kxscfl4: 4194560 
          dnum_kksfcxe: 0 
        Child Node: 0  ID=3 reason=Optimizer mismatch(13) size=3x4 
          kxscflg: 32 
          kxscfl4: 4194560 
          dnum_kksfcxe: 0 
        Child Node: 0  ID=3 reason=Optimizer mismatch(13) size=3x4 
          kxscflg: 32 
          kxscfl4: 4194560 
          dnum_kksfcxe: 0    kkscs=0xb2132df0 nxt=0xb21331f8 flg=11 cld=0 
hd=0xa1a00330 par=0xb21328e8
   Mutex 0xb2132df0(0, 0) idn 3000000000
   ct=19 hsh=0 unp=(nil) unn=0 hvl=b2133798 nhv=0 ses=(nil)
   hep=0xb2132e80 flg=80 ld=0 ob=(nil) ptr=(nil) fex=(nil)
   kkscs=0xb21331f8 nxt=0xb9a94588 flg=1a cld=1 hd=0xaf246848 par=0xb21328e8
   Mutex 0xb21331f8(0, 0) idn 0
   ct=12 hsh=0 unp=(nil) unn=0 hvl=b21336e0 nhv=0 ses=(nil)
   hep=0xb2133288 flg=80 ld=1 ob=0xb2c09860 ptr=0xab22a250 fex=0xab2295f0
   kkscs=0xb9a94588 nxt=0xb9a94930 flg=18 cld=2 hd=0xaf3c53e8 par=0xb21328e8
   Mutex 0xb9a94588(0, 0) idn 0
   ct=13 hsh=0 unp=(nil) unn=0 hvl=b21336a0 nhv=0 ses=(nil)
   hep=0xb9a94618 flg=80 ld=1 ob=0xb97655a0 ptr=0xa4e14f58 fex=0xa4e142f8
   kkscs=0xb9a94930 nxt=0xa840b1b0 flg=14 cld=3 hd=0xa1515da8 par=0xb21328e8
   Mutex 0xb9a94930(0, 0) idn 0
   ct=14 hsh=0 unp=(nil) unn=0 hvl=b2133638 nhv=1 ses=0xc0467f40
   hsv[0]=0
   hep=0xb9a949c0 flg=80 ld=1 ob=0xa81e1108 ptr=0xb16c2ea0 fex=0xb16c2240
   kkscs=0xa840b1b0 nxt=(nil) flg=18 cld=4 hd=0xaf3038c8 par=0xb21328e8
   Mutex 0xa840b1b0(0, 0) idn 0
   ct=19 hsh=0 unp=(nil) unn=0 hvl=b2133660 nhv=0 ses=(nil)
   hep=0xa840b240 flg=80 ld=1 ob=0x9fae5060 ptr=0xb8bc6b48 fex=0xb8bc5ee8
cursor instantiation=0x2ac85fded0d8 used=1379295804 exec_id=16777397 exec=1
 child#4(0xaf3038c8) pcs=0xa840b1b0
  clk=0xb6c31f68 ci=0x9fae5148 pn=0xaf984ba0 ctx=0xb8bc6b48
 kgsccflg=0 llk[0x2ac85fded0e0,0x2ac85fded0e0] idx=0
 xscflg=c0110676 fl2=5d000008 fl3=42222008 fl4=180
 sharing failure(s)=62000
----- Bind Info (kkscoacd) -----
 Bind#0
  oacdty=01 mxl=32(24) mxlc=00 mal=00 scl=00 pre=00
  oacflg=03 fl2=1000010 frm=01 csi=873 siz=32 off=0
  kxsbbbfp=2ac85fdecae0  bln=32  avl=00  flg=05
 Frames pfr 0x2ac85fdecea8 siz=27104 efr 0x2ac85fdecd98 siz=27088
 kxscphp=0x2ac85fdc03d8 siz=984 inu=456 nps=408
 kxscbhp=0x2ac85fdc01f8 siz=984 inu=176 nps=56
 kxscwhp=0x2ac85fdc0798 siz=16352 inu=15344 nps=5160
Starting SQL statement dump
SQL Information
user_id=161 user_name=WX_TMS_TEST module=JDBC Thin Client action=
sql_id=4x3cjtfs37n4v plan_hash_value=-785040234 problem_type=4
----- Current SQL Statement for this session (sql_id=4x3cjtfs37n4v) -----
select distinct viewbutton5_.SYS_VIEW_BUTTON_ID as SYS1_155_, 
viewbutton5_.RECORD_VERSION as RECORD2_155_, viewbutton5_.BTN_NAME as BTN3_155_, viewbutton5_.BTN_TITLE_KEY as BTN4_155_, viewbutton5_.BTN_MSG_KEY as BTN5_155_,
viewbutton5_.BUTTON_URL as BUTTON6_155_, viewbutton5_.SYS_MENU_ITEM_ID as SYS7_155_ 
from SYS_ROLE_MENU_BUTTON rolemenubu0_ left outer join SYS_ROLE_MENU_ITEM rolemenuit1_ 
on rolemenubu0_.SYS_ROLE_MENU_ITEM_ID=rolemenuit1_.SYS_ROLE_MENU_ITEM_ID left outer 
join SYS_ROLE role2_ on rolemenuit1_.SYS_ROLE_ID=role2_.SYS_ROLE_ID left outer join 
SYS_ROLE_USER roleusers3_ on role2_.SYS_ROLE_ID=roleusers3_.SYS_ROLE_ID left 
outer join SYS_USER user4_ on roleusers3_.USER_ID=user4_.USER_ID inner join 
SYS_VIEW_BUTTON viewbutton5_ on 
rolemenubu0_.SYS_VIEW_BUTTON_ID=viewbutton5_.SYS_VIEW_BUTTON_ID where user4_.USER_CODE=:1
sql_text_length=837
sql=select distinct viewbutton5_.SYS_VIEW_BUTTON_ID as SYS1_155_, viewbutton5_.RECORD_VERSION as RECORD2_155_, viewbutton5_.BTN_NAME as BTN3_155_, viewbutton5_.BTN_TITLE_KEY as BTN4_155_, viewbutton5_.BTN_MSG_KEY as BTN5_155_, viewbutton5_.BUTTON_URL as BUTTON
sql=6_155_, viewbutton5_.SYS_MENU_ITEM_ID as SYS7_155_ from SYS_ROLE_MENU_BUTTON rolemenubu0_ 
left outer join SYS_ROLE_MENU_ITEM rolemenuit1_ on rolemenubu0_.SYS_ROLE_MENU_ITEM_ID=rolemenuit1_.SYS_ROLE_MENU_ITEM_ID left outer 
join SYS_ROLE role2_ on rolemenuit
sql=1_.SYS_ROLE_ID=role2_.SYS_ROLE_ID left outer join SYS_ROLE_USER roleusers3_ on role2_.SYS_ROLE_ID=roleusers3_.SYS_ROLE_ID left outer join SYS_USER user4_ on roleusers3_.USER_ID=user4_.USER_ID inner join SYS_VIEW_BUTTON viewbutton5_ on 
rolemenubu0_.SYS_VIEW
sql=_BUTTON_ID=viewbutton5_.SYS_VIEW_BUTTON_ID where user4_.USER_CODE=:1
...
...

3 看到这里,没有太好的解决思路。同事给出提示信息说,同一套库,另外一套应用环境下,通过WebLogic来访问数据库时,则不会报错。难道是因为JDBC的不同驱动导致的?寻求MetaLink,Troubleshooting ORA-3137 [12333] Errors Encountered When Using Oracle JDBC Driver (Doc ID 1361107.1)

通过Metalink上的提示,得到造成该错误的可能原因:

① 部分版本的JDBC驱动会引起该错误:

Bug 9445675  NO MORE DATA TO READ FROM SOCKET WHEN USING END-TO-END METRICS

This bug does affect the JDBC driver.  This bug may be the cause when all of the following conditions are met:

  1. You are using the 10.1.x.x or the 11.2.0.1 JDBC driver; the bug does not affect 10.2.x.x, or 11.1.x.x versions of the driver, nor versions 11.2.0.2 or above
  2. You are using end-to-end metrics in your Java code
  3. The server side ORA-3137 [12333] error is accompanied by the client side Java exception “No more data to read from socket”

This bug is fixed in the 11.2.0.2 version of the JDBC driver and above.  It is discussed in the following notes:

Note 9445675.8 Bug 9445675 – “No more data” / ORA-3137 using end to end metrics with JDBC Thin

Note 1081275.1 “java.sql.SQLRecoverableException: No more data to read from socket” is Thrown When End-to-end Metrics is Used

② 数据库自身的BUG也会导致该错误:

Unpublished Bug:9703463 – ORA-3137 [12333] or ORA-600 [kpobav-1] When Using Bind Peeking

This bug affects versions 11.1.0.6, 11.1.0.7, and 11.2.0.1 of the RDBMS.  It is fixed in version 11.2.0.2 of the database.

It can also occur intermittently; similarly to unpublished Bug:8625762, this is a bind peeking bug.

==================================================

Unpublished Bug 9373370  DATA BASE RETURNS WRONG CURSORID WHEN THERE IS AN ORA-01013

This bug affects the 10.2, 11.1, 11.2.0.1, and 11.2.0.2 databases.  It is discussed in the following note:

Note 9373370.8 Bug 9373370 – The wrong cursor may be executed by JDBC thin following a query timeout / ORA-3137 [12333]

While the bug primarily manifests in ORA-1006 or ORA-1008 errors, the problem may also result in ORA-600 [12333] or ORA-3137 [12333] errors appearing on the server side.

判断本案例的错误应该是 Bug:9703463导致的,从trace文件中看到该SQL语句的确用到了绑定变量,且数据库版本是11.2.0.1.0。

解决思路:

①  可以通过更换不同版本的JDBC驱动来避免该错误,也说明为什么同事在另外一套环境下,通过Weblogic的JDBC来访问数据库时,则不会遇到该错误;

② 给数据库打patch,初步认为可以通过打Patch:9703463 来解决;

③ 通过修改数据库参数来规避该错误:

修改之后,同事用之前的Tomcat那个版本的驱动来重新访问数据库时,则不再报错;

④ 直接升级数据库版本至11.2.0.3.0,通过导出导入的方式将刚项目组下的schema数据复制一份到一套11.2.0.3.0的库上,重新使用Tomcat那个版本的驱动来重新访问数据库时,亦不再报错。

索引扫描路径之2:Index Range Scan

index_range_scan

在上一篇文章,索引扫描路径之1:Index Unique Scan 中,详细描述了Oracle的CBO优化器会在何种情形下选择通过Index Unique Scan的方式来访问数据。

本篇描述CBO优化器会在什么场景下选择Index Range Scan的路径来访问数据?

Index Range Scan通常见于通过索引去查找具有高选择性的数据。默认情况下,Oracle是按照被索引字段升序排序来存放索引记录的,如果被索引字段有重复值,则按照相应的ROWID做升序排序来存放。

较为常见的Index Range ScanWHERE条件如下:

Col1=:b1

Col1>:b1

Col1>=:b1

Col1<:b1

Col1<=:b1

或者是通过AND连接的满足上述可构成前导列的条件。再或者WHERE条件中有使用BETWEEN…AND条件。

同样,给出验证与说明:

系统版本、数据库版本和平台,以及测试表同与之前的环境。即选择Linux X86_64平台上的一套11.2.0.1.0库,使用HR这个schema下的departments表。

1 唯一索引,CBO选择Index Range Scan的场景

SQL> set autotrace trace
SQL> select * from departments where department_id>260;

Execution Plan
----------------------------------------------------------
Plan hash value: 3346631158

-------------------------------------------------------------------------------------------
| Id  | Operation                   | Name        | Rows  | Bytes | Cost (%CPU)| Time     |
-------------------------------------------------------------------------------------------
|   0 | SELECT STATEMENT            |             |     1 |    20 |     2   (0)| 00:00:01 |
|   1 |  TABLE ACCESS BY INDEX ROWID| DEPARTMENTS |     1 |    20 |     2   (0)| 00:00:01 |
|*  2 |   INDEX RANGE SCAN          | DEPT_ID_PK  |     1 |       |     1   (0)| 00:00:01 |
-------------------------------------------------------------------------------------------

Predicate Information (identified by operation id):
---------------------------------------------------

   2 - access("DEPARTMENT_ID">260)

Statistics
----------------------------------------------------------
          0  recursive calls
          0  db block gets
          2  consistent gets
          0  physical reads
          0  redo size
        743  bytes sent via SQL*Net to client
        492  bytes received via SQL*Net from client
          2  SQL*Net roundtrips to/from client
          0  sorts (memory)
          0  sorts (disk)
          1  rows processed

SQL>

从上,即使是从唯一索引中获取一条数据[满足department_id>260条件的记录,确实只有1条],优化器也选择了走INDEX RANGE SCAN,因为上述SQL并不满足Index Unique Scan的条件。恰恰满足了INDEX RANGE SCAN 的条件。

2 接下来,一个典型的使用INDEX RANGE SCAN 的场景:

SQL> select * from departments where location_id=1700;

21 rows selected.

Execution Plan
----------------------------------------------------------
Plan hash value: 735461860

------------------------------------------------------------------------------------------------
| Id  | Operation                   | Name             | Rows  | Bytes | Cost (%CPU)| Time     |
------------------------------------------------------------------------------------------------
|   0 | SELECT STATEMENT            |                  |    21 |   420 |     2   (0)| 00:00:01 |
|   1 |  TABLE ACCESS BY INDEX ROWID| DEPARTMENTS      |    21 |   420 |     2   (0)| 00:00:01 |
|*  2 |   INDEX RANGE SCAN          | DEPT_LOCATION_IX |    21 |       |     1   (0)| 00:00:01 |
------------------------------------------------------------------------------------------------

Predicate Information (identified by operation id):
---------------------------------------------------

   2 - access("LOCATION_ID"=1700)

Statistics
----------------------------------------------------------
          1  recursive calls
          0  db block gets
          6  consistent gets
          1  physical reads
          0  redo size
       1468  bytes sent via SQL*Net to client
        503  bytes received via SQL*Net from client
          3  SQL*Net roundtrips to/from client
          0  sorts (memory)
          0  sorts (disk)
         21  rows processed

SQL>

或者:

SQL> select * from departments where location_id<=1700;

23 rows selected.

Execution Plan
----------------------------------------------------------
Plan hash value: 735461860

------------------------------------------------------------------------------------------------
| Id  | Operation                   | Name             | Rows  | Bytes | Cost (%CPU)| Time     |
------------------------------------------------------------------------------------------------
|   0 | SELECT STATEMENT            |                  |    24 |   480 |     2   (0)| 00:00:01 |
|   1 |  TABLE ACCESS BY INDEX ROWID| DEPARTMENTS      |    24 |   480 |     2   (0)| 00:00:01 |
|*  2 |   INDEX RANGE SCAN          | DEPT_LOCATION_IX |    24 |       |     1   (0)| 00:00:01 |
------------------------------------------------------------------------------------------------
Predicate Information (identified by operation id):
---------------------------------------------------

2 - access("LOCATION_ID"<=1700)

Statistics
----------------------------------------------------------
          0  recursive calls
          0  db block gets
          6  consistent gets
          0  physical reads
          0  redo size
       1502  bytes sent via SQL*Net to client
        503  bytes received via SQL*Net from client
          3  SQL*Net roundtrips to/from client
          0  sorts (memory)
          0  sorts (disk)
         23  rows processed

SQL>

再或者:

SQL> select * from departments where location_id>=1700;

25 rows selected.

Execution Plan
----------------------------------------------------------
Plan hash value: 735461860

------------------------------------------------------------------------------------------------
| Id  | Operation                   | Name             | Rows  | Bytes | Cost (%CPU)| Time     |
------------------------------------------------------------------------------------------------
|   0 | SELECT STATEMENT            |                  |    25 |   500 |     2   (0)| 00:00:01 |
|   1 |  TABLE ACCESS BY INDEX ROWID| DEPARTMENTS      |    25 |   500 |     2   (0)| 00:00:01 |
|*  2 |   INDEX RANGE SCAN          | DEPT_LOCATION_IX |    25 |       |     1   (0)| 00:00:01 |
------------------------------------------------------------------------------------------------

Predicate Information (identified by operation id):
---------------------------------------------------

   2 - access("LOCATION_ID">=1700)

Statistics
----------------------------------------------------------
          1  recursive calls
          0  db block gets
          6  consistent gets
          0  physical reads
          0  redo size
       1561  bytes sent via SQL*Net to client
        503  bytes received via SQL*Net from client
          3  SQL*Net roundtrips to/from client
          0  sorts (memory)
          0  sorts (disk)
         25  rows processed

SQL>

可以看到,不管是location_id>=1700还是location_id=1700或者是location_id<=1700条件,CBO都选择了location_id字段上的索引DEPT_LOCATION_IX通过INDEX RANGE SCAN 的方式去获取数据。

3 接下来,BETWEEN…AND的场景:

SQL> select department_id,location_id,rowid from departments where location_id between 1500 and 2600;

25 rows selected.

Execution Plan
----------------------------------------------------------
Plan hash value: 735461860

------------------------------------------------------------------------------------------------
| Id  | Operation                   | Name             | Rows  | Bytes | Cost (%CPU)| Time     |
------------------------------------------------------------------------------------------------
|   0 | SELECT STATEMENT            |                  |    26 |   494 |     2   (0)| 00:00:01 |
|   1 |  TABLE ACCESS BY INDEX ROWID| DEPARTMENTS      |    26 |   494 |     2   (0)| 00:00:01 |
|*  2 |   INDEX RANGE SCAN          | DEPT_LOCATION_IX |    26 |       |     1   (0)| 00:00:01 |
------------------------------------------------------------------------------------------------

Predicate Information (identified by operation id):
---------------------------------------------------

     2 - access("LOCATION_ID">=1500 AND "LOCATION_ID"<=2600)

Statistics
----------------------------------------------------------
          1  recursive calls
          0  db block gets
          6  consistent gets
          0  physical reads
          0  redo size
       1556  bytes sent via SQL*Net to client
        503  bytes received via SQL*Net from client
          3  SQL*Net roundtrips to/from client
          0  sorts (memory)
          0  sorts (disk)
         25  rows processed

SQL>

那么,如果是通过department_id字段来做BETWEEN…AND条件测试呢?即测试在一个唯一性索引上使用BETWEEN…AND条件的情形。

SQL> select department_id,location_id,rowid from departments where department_id between 120 and 130;

Execution Plan
----------------------------------------------------------
Plan hash value: 3346631158

-------------------------------------------------------------------------------------------
| Id  | Operation                   | Name        | Rows  | Bytes | Cost (%CPU)| Time     |
-------------------------------------------------------------------------------------------
|   0 | SELECT STATEMENT            |             |     3 |    57 |     2   (0)| 00:00:01 |
|   1 |  TABLE ACCESS BY INDEX ROWID| DEPARTMENTS |     3 |    57 |     2   (0)| 00:00:01 |
|*  2 |   INDEX RANGE SCAN          | DEPT_ID_PK  |     3 |       |     1   (0)| 00:00:01 |
-------------------------------------------------------------------------------------------

Predicate Information (identified by operation id):
---------------------------------------------------

   2 - access("DEPARTMENT_ID">=120 AND "DEPARTMENT_ID"<=130)

Statistics
----------------------------------------------------------
          1  recursive calls
          0  db block gets
          4  consistent gets
          0  physical reads
          0  redo size
        748  bytes sent via SQL*Net to client
        492  bytes received via SQL*Net from client
          2  SQL*Net roundtrips to/from client
          0  sorts (memory)
          0  sorts (disk)
          2  rows processed

SQL>

测试结果发现,即使是唯一索引,CBO依然会选择INDEX RANGE SCAN。
反之,如果条件换做是department_id between 120 and 120的话,很明显,聪明的CBO这次肯定会选择Index Unique Scan。

SQL> select department_id,location_id,rowid from departments where department_id between 120 and 120;

Execution Plan
----------------------------------------------------------
Plan hash value: 4024094692

-------------------------------------------------------------------------------------------
| Id  | Operation                   | Name        | Rows  | Bytes | Cost (%CPU)| Time     |
-------------------------------------------------------------------------------------------
|   0 | SELECT STATEMENT            |             |     1 |    19 |     1   (0)| 00:00:01 |
|   1 |  TABLE ACCESS BY INDEX ROWID| DEPARTMENTS |     1 |    19 |     1   (0)| 00:00:01 |
|*  2 |   INDEX UNIQUE SCAN         | DEPT_ID_PK  |     1 |       |     0   (0)| 00:00:01 |
-------------------------------------------------------------------------------------------

Predicate Information (identified by operation id):
---------------------------------------------------

   2 - access("DEPARTMENT_ID"=120)

Statistics
----------------------------------------------------------
          0  recursive calls
          0  db block gets
          2  consistent gets
          0  physical reads
          0  redo size
        673  bytes sent via SQL*Net to client
        492  bytes received via SQL*Net from client
          2  SQL*Net roundtrips to/from client
          0  sorts (memory)
          0  sorts (disk)
          1  rows processed

SQL>

4 最后,看一个关于INDEX RANGE SCAN DESCENDING的场景:

CBO选择INDEX RANGE SCAN DESCENDING的方式来获取数据,适用于 ORDER BY column_name DESC的场景。在默认情况下,索引是按照索引关键字升序来存放数据的。

按照常理来讲,如果有ORDER BY column_name DESC的条件,那么

① 需要先从索引中读取数据;

② 再按照条件中column_name字段做降序排序。

而选择INDEX RANGE SCAN DESCENDING,则是直接在索引上按照索引关键字降序查找数据,这样正是为了避免先按照索引来查找数据,然后再做一次降序排序的操作。

SQL> set autotrace on
SQL> select department_id,location_id,rowid from departments where location_id between 1500 and 2600 order by location_id desc;

DEPARTMENT_ID LOCATION_ID ROWID
------------- ----------- ------------------
           80        2500 AAAz+PABRAAAACbAAH
           40        2400 AAAz+PABRAAAACbAAD
           20        1800 AAAz+PABRAAAACbAAB
          270        1700 AAAz+PABRAAAACbAAa
          260        1700 AAAz+PABRAAAACbAAZ
          250        1700 AAAz+PABRAAAACbAAY
          240        1700 AAAz+PABRAAAACbAAX
          230        1700 AAAz+PABRAAAACbAAW
          220        1700 AAAz+PABRAAAACbAAV
          210        1700 AAAz+PABRAAAACbAAU
          200        1700 AAAz+PABRAAAACbAAT

DEPARTMENT_ID LOCATION_ID ROWID
------------- ----------- ------------------
          190        1700 AAAz+PABRAAAACbAAS
          180        1700 AAAz+PABRAAAACbAAR
          170        1700 AAAz+PABRAAAACbAAQ
          160        1700 AAAz+PABRAAAACbAAP
          150        1700 AAAz+PABRAAAACbAAO
          140        1700 AAAz+PABRAAAACbAAN
          130        1700 AAAz+PABRAAAACbAAM
          120        1700 AAAz+PABRAAAACbAAL
          110        1700 AAAz+PABRAAAACbAAK
          100        1700 AAAz+PABRAAAACbAAJ
           90        1700 AAAz+PABRAAAACbAAI

DEPARTMENT_ID LOCATION_ID ROWID
------------- ----------- ------------------
           30        1700 AAAz+PABRAAAACbAAC
           10        1700 AAAz+PABRAAAACbAAA
           50        1500 AAAz+PABRAAAACbAAE

25 rows selected.

Execution Plan
----------------------------------------------------------
Plan hash value: 2689299823

-------------------------------------------------------------------------------------------------
| Id  | Operation                    | Name             | Rows  | Bytes | Cost (%CPU)| Time     |
-------------------------------------------------------------------------------------------------
|   0 | SELECT STATEMENT             |                  |    26 |   494 |     2   (0)| 00:00:01 |
|   1 |  TABLE ACCESS BY INDEX ROWID | DEPARTMENTS      |    26 |   494 |     2   (0)| 00:00:01 |
|*  2 |   INDEX RANGE SCAN DESCENDING| DEPT_LOCATION_IX |    26 |       |     1   (0)| 00:00:01 |
-------------------------------------------------------------------------------------------------

Predicate Information (identified by operation id):
---------------------------------------------------

   2 - access("LOCATION_ID">=1500 AND "LOCATION_ID"<=2600)

Statistics
----------------------------------------------------------
          0  recursive calls
          0  db block gets
          6  consistent gets
          0  physical reads
          0  redo size
       1575  bytes sent via SQL*Net to client
        534  bytes received via SQL*Net from client
          3  SQL*Net roundtrips to/from client
          0  sorts (memory)
          0  sorts (disk)
         25  rows processed

SQL>

从上可以看到,对于LOCATION_ID=1700的记录,则正是按照ROWID做的降序排序操作。

索引扫描路径之1:Index Unique Scan

index_unique_scan

近期在读一本名为《Expert Indexing in Oracle Database 11g》的书,个人觉得写的很不错,收获颇多。在这里就把一些关于CBO 通过INDEX 扫描数据的相关知识稍作整理,算是读书笔记。

其中,在读到第7章,Tuning Index Usage时,提到常见的通过索引访问数据的方式有下述几种:

Index Unique Scan;

Index Range Scan;

Index Skip Scan;

Index Full Scan;

Index Fast Full Scan;

        这里,首先说Index Unique Scan。

CBO【Cost Based Optimizer】通常在什么场景下会选择通过Index Unique Scan的方式来访问数据呢?

1 必须是通过唯一索引【UNIQUE】来访问数据;

2 通过唯一索引来访问数据时,每次返回的记录数必须是1条;

3 WHERE从句中必须要用等值【=】条件来过滤数据;

        我个人目前的理解是,必须同时满足上述3个条件,CBO才会选择通过Index Unique Scan的路径来访问数据。

下面给出验证:

1 操作系统版本和数据库版本:
操作系统:

[oracle@oracle11g ~]$ uname -rm
2.6.18-194.el5 x86_64
[oracle@oracle11g ~]$

数据库:

SQL> select * from v$version;

BANNER
--------------------------------------------------------------------------------
Oracle Database 11g Enterprise Edition Release 11.2.0.1.0 - 64bit Production
PL/SQL Release 11.2.0.1.0 - Production
CORE    11.2.0.1.0      Production
TNS for Linux: Version 11.2.0.1.0 - Production
NLSRTL Version 11.2.0.1.0 - Production

SQL>

2 测试表、表结构、表数据如下:

SQL> conn hr/hr
Connected.
SQL> desc departments;
 Name                                      Null?    Type
 ----------------------------------------- -------- ----------------------------
 DEPARTMENT_ID                             NOT NULL NUMBER(4)
 DEPARTMENT_NAME                           NOT NULL VARCHAR2(30)
 MANAGER_ID                                         NUMBER(6)
 LOCATION_ID                                        NUMBER(4)

SQL> select * from departments;

DEPARTMENT_ID DEPARTMENT_NAME                MANAGER_ID LOCATION_ID
------------- ------------------------------ ---------- -----------
           10 Administration                        200        1700
           20 Marketing                             201        1800
           30 Purchasing                            114        1700
           40 Human Resources                       203        2400
           50 Shipping                              121        1500
           60 IT                                    103        1400
           70 Public Relations                      204        2700
           80 Sales                                 145        2500
           90 Executive                             100        1700
          100 Finance                               108        1700
          110 Accounting                            205        1700

DEPARTMENT_ID DEPARTMENT_NAME                MANAGER_ID LOCATION_ID
------------- ------------------------------ ---------- -----------
          120 Treasury                                         1700
          130 Corporate Tax                                    1700
          140 Control And Credit                               1700
          150 Shareholder Services                             1700
          160 Benefits                                         1700
          170 Manufacturing                                    1700
          180 Construction                                     1700
          190 Contracting                                      1700
          200 Operations                                       1700
          210 IT Support                                       1700
          220 NOC                                              1700

DEPARTMENT_ID DEPARTMENT_NAME                MANAGER_ID LOCATION_ID
------------- ------------------------------ ---------- -----------
          230 IT Helpdesk                                      1700
          240 Government Sales                                 1700
          250 Retail Sales                                     1700
          260 Recruiting                                       1700
          270 Payroll                                          1700

27 rows selected.

SQL>

3 该表上的索引信息如下:

SQL> select index_name,index_type,table_name,uniqueness from user_indexes where table_name='DEPARTMENTS';

INDEX_NAME                     INDEX_TYPE                  TABLE_NAME                     UNIQUENES
------------------------------ --------------------------- ------------------------------ ---------
DEPT_ID_PK                     NORMAL                      DEPARTMENTS                    UNIQUE
DEPT_LOCATION_IX               NORMAL                      DEPARTMENTS                    NONUNIQUE

SQL> select * from user_ind_columns where table_name='DEPARTMENTS';

INDEX_NAME                     TABLE_NAME                     COLUMN_NAME     COLUMN_POSITION COLUMN_LENGTH CHAR_LENGTH DESC
------------------------------ ------------------------------ --------------- --------------- ------------- ----------- ----
DEPT_ID_PK                     DEPARTMENTS                    DEPARTMENT_ID                 1            22           0 ASC
DEPT_LOCATION_IX               DEPARTMENTS                    LOCATION_ID                   1            22           0 ASC

SQL>

从上看到departments表有2个索引,其中在DEPARTMENT_ID字段上的索引DEPT_ID_PK 为主键索引,是个UNIQUE类型的索引。而LOCATION_ID 字段上的DEPT_LOCATION_IX则为非唯一【NONUNIQUE】索引。

4 通过该表上的主键字段department_id来定位数据:

SQL> set autotrace trace
SQL> select department_id from departments where department_id=270;

Execution Plan
----------------------------------------------------------
Plan hash value: 1856623209

--------------------------------------------------------------------------------
| Id  | Operation         | Name       | Rows  | Bytes | Cost (%CPU)| Time     |
--------------------------------------------------------------------------------
|   0 | SELECT STATEMENT  |            |     1 |     4 |     0   (0)| 00:00:01 |
|*  1 |  INDEX UNIQUE SCAN| DEPT_ID_PK |     1 |     4 |     0   (0)| 00:00:01 |
--------------------------------------------------------------------------------

Predicate Information (identified by operation id):
---------------------------------------------------

   1 - access("DEPARTMENT_ID"=270)

Statistics
----------------------------------------------------------
          1  recursive calls
          0  db block gets
          1  consistent gets
          0  physical reads
          0  redo size
        532  bytes sent via SQL*Net to client
        524  bytes received via SQL*Net from client
          2  SQL*Net roundtrips to/from client
          0  sorts (memory)
          0  sorts (disk)
          1  rows processed

SQL>

从上述执行计划里看到,CBO选择了Index Unique Scan,因为department_id字段上有一个DEPT_ID_PK 的UNIQUE类型的索引,且上述SQL满足Index Unique Scan的条件。

而如果WHERE条件换成department_id>=270时,则CBO选择了Index Range Scan的访问路径,因为该WHERE条件是>=而非等值匹配。CBO认为返回的记录数可能不止1条,即使实际情况下满足条件的记录数确实是1条,所以选择了Index Range Scan。

SQL> select department_id from departments where department_id>=270;

Execution Plan
----------------------------------------------------------
Plan hash value: 4271874676

-------------------------------------------------------------------------------
| Id  | Operation        | Name       | Rows  | Bytes | Cost (%CPU)| Time     |
-------------------------------------------------------------------------------
|   0 | SELECT STATEMENT |            |     1 |     4 |     1   (0)| 00:00:01 |
|*  1 |  INDEX RANGE SCAN| DEPT_ID_PK |     1 |     4 |     1   (0)| 00:00:01 |
-------------------------------------------------------------------------------

Predicate Information (identified by operation id):
---------------------------------------------------

   1 - access("DEPARTMENT_ID">=270)

Statistics
----------------------------------------------------------
          0  recursive calls
          0  db block gets
          1  consistent gets
          0  physical reads
          0  redo size
        532  bytes sent via SQL*Net to client
        524  bytes received via SQL*Net from client
          2  SQL*Net roundtrips to/from client
          0  sorts (memory)
          0  sorts (disk)
          1  rows processed

SQL>

5 通过该表上的location_id字段来定位数据的场景:

SQL> select location_id from departments where location_id=2700;

Execution Plan
----------------------------------------------------------
Plan hash value: 2790119751

-------------------------------------------------------------------------------------
| Id  | Operation        | Name             | Rows  | Bytes | Cost (%CPU)| Time     |
-------------------------------------------------------------------------------------
|   0 | SELECT STATEMENT |                  |     1 |     3 |     1   (0)| 00:00:01 |
|*  1 |  INDEX RANGE SCAN| DEPT_LOCATION_IX |     1 |     3 |     1   (0)| 00:00:01 |
-------------------------------------------------------------------------------------

Predicate Information (identified by operation id):
---------------------------------------------------

   1 - access("LOCATION_ID"=2700)

Statistics
----------------------------------------------------------
          0  recursive calls
          0  db block gets
          1  consistent gets
          0  physical reads
          0  redo size
        529  bytes sent via SQL*Net to client
        524  bytes received via SQL*Net from client
          2  SQL*Net roundtrips to/from client
          0  sorts (memory)
          0  sorts (disk)
          1  rows processed

SQL> select location_id from departments where location_id=1700;

21 rows selected.

Execution Plan
----------------------------------------------------------
Plan hash value: 2790119751

-------------------------------------------------------------------------------------
| Id  | Operation        | Name             | Rows  | Bytes | Cost (%CPU)| Time     |
-------------------------------------------------------------------------------------
|   0 | SELECT STATEMENT |                  |    21 |    63 |     1   (0)| 00:00:01 |
|*  1 |  INDEX RANGE SCAN| DEPT_LOCATION_IX |    21 |    63 |     1   (0)| 00:00:01 |
-------------------------------------------------------------------------------------

Predicate Information (identified by operation id):
---------------------------------------------------

   1 - access("LOCATION_ID"=1700)

Statistics
----------------------------------------------------------
          1  recursive calls
          0  db block gets
          3  consistent gets
          0  physical reads
          0  redo size
        901  bytes sent via SQL*Net to client
        535  bytes received via SQL*Net from client
          3  SQL*Net roundtrips to/from client
          0  sorts (memory)
          0  sorts (disk)
         21  rows processed

SQL>

从上述执行计划看到,通过LOCATION_ID 字段上的DEPT_LOCATION_IX来定位数据时,不管是通过location_id=2700还是location_id=1400或者location_id=1700,结果都是走INDEX RANGE SCAN。因为DEPT_LOCATION_IX不是唯一索引,即使location_id=2700或者location_id=1400条件能确保返回的记录数只有1条,CBO也不会选择Index Unique Scan。

6  通过唯一索引、非唯一索引来定位数据的场景:

非唯一索引的情况:

SQL> create table all_t as select object_id,object_name from all_objects;

Table created.

SQL> desc all_t;
 Name                                      Null?    Type
 ----------------------------------------- -------- ----------------------------
 OBJECT_ID                                 NOT NULL NUMBER
 OBJECT_NAME                               NOT NULL VARCHAR2(30)

SQL> select table_name,index_name,index_type,uniqueness from user_indexes where table_name='ALL_T';

no rows selected

SQL> create index idx_all_t on all_t(object_id);

Index created.

SQL> select table_name,index_name,index_type,uniqueness from user_indexes where table_name='ALL_T';

TABLE_NAME                     INDEX_NAME                     INDEX_TYPE                  UNIQUENES
------------------------------ ------------------------------ --------------------------- ---------
ALL_T                          IDX_ALL_T                      NORMAL                      NONUNIQUE

SQL> exec dbms_stats.gather_table_stats(user,'all_t',cascade=>true);

PL/SQL procedure successfully completed.

SQL> set autotrace trace
SQL> select * from all_t where object_id=30000;

Execution Plan
----------------------------------------------------------
Plan hash value: 2459308467

-----------------------------------------------------------------------------------------
| Id  | Operation                   | Name      | Rows  | Bytes | Cost (%CPU)| Time     |
-----------------------------------------------------------------------------------------
|   0 | SELECT STATEMENT            |           |     1 |    31 |     2   (0)| 00:00:01 |
|   1 |  TABLE ACCESS BY INDEX ROWID| ALL_T     |     1 |    31 |     2   (0)| 00:00:01 |
|*  2 |   INDEX RANGE SCAN          | IDX_ALL_T |     1 |       |     1   (0)| 00:00:01 |
-----------------------------------------------------------------------------------------

Predicate Information (identified by operation id):
---------------------------------------------------

   2 - access("OBJECT_ID"=30000)

Statistics
----------------------------------------------------------
          0  recursive calls
          0  db block gets
          4  consistent gets
          0  physical reads
          0  redo size
        627  bytes sent via SQL*Net to client
        523  bytes received via SQL*Net from client
          2  SQL*Net roundtrips to/from client
          0  sorts (memory)
          0  sorts (disk)
          1  rows processed

SQL>

唯一索引的情况:

SQL> drop index idx_all_t ;

Index dropped.

SQL> create unique index idx_all_t on all_t(object_id);

Index created.

SQL> select table_name,index_name,index_type,uniqueness from user_indexes where table_name='ALL_T';

TABLE_NAME                     INDEX_NAME                     INDEX_TYPE                  UNIQUENES
------------------------------ ------------------------------ --------------------------- ---------
ALL_T                          IDX_ALL_T                      NORMAL                      UNIQUE

SQL> set autotrace trace
SQL> exec dbms_stats.gather_table_stats(user,'all_t',cascade=>true);

PL/SQL procedure successfully completed.

SQL> select * from all_t where object_id=30000;

Execution Plan
----------------------------------------------------------
Plan hash value: 3932529197

-----------------------------------------------------------------------------------------
| Id  | Operation                   | Name      | Rows  | Bytes | Cost (%CPU)| Time     |
-----------------------------------------------------------------------------------------
|   0 | SELECT STATEMENT            |           |     1 |    31 |     2   (0)| 00:00:01 |
|   1 |  TABLE ACCESS BY INDEX ROWID| ALL_T     |     1 |    31 |     2   (0)| 00:00:01 |
|*  2 |   INDEX UNIQUE SCAN         | IDX_ALL_T |     1 |       |     1   (0)| 00:00:01 |
-----------------------------------------------------------------------------------------

Predicate Information (identified by operation id):
---------------------------------------------------

   2 - access("OBJECT_ID"=30000)

Statistics
----------------------------------------------------------
          0  recursive calls
          0  db block gets
          3  consistent gets
          0  physical reads
          0  redo size
        491  bytes sent via SQL*Net to client
        512  bytes received via SQL*Net from client
          1  SQL*Net roundtrips to/from client
          0  sorts (memory)
          0  sorts (disk)
          1  rows processed

SQL>

从上可以看到,虽然测试表all_t上的字段object_id字段虽然的确可以确保唯一,但是在第一种情况下,索引IDX_ALL_T为非唯一索引的时候,CBO毅然选择了INDEX RANGE SCAN,而第二种情况下,却是Index Unique Scan。

也就是说,即使可以确保表中某个字段是唯一的,如果该字段上的索引不是唯一的,那么CBO选择的将是通过INDEX RANGE SCAN的路径来访问数据。想要表达的是,真实场景下这种情况的确会存在,因为有些系统是通过应用程序来保证表中的字段唯一,而并没有在表上对应的字段上通过创建唯一约束或者是唯一索引来保证数据的唯一性。那么,这样的话,将会导致CBO在选择执行计划的情况下,有可能会出现偏差。所以,对于这种情况下,即使应用程序可以保证数据的唯一性,最好还是在表上创建一个唯一索引比较稳妥。

最后,留一个小疑问给所有的看到这篇文章的朋友,对于第6种情况,是不是第二种场景下的Index Unique Scan的效率要高于第一种场景下的INDEX RANGE SCAN?因为,从执行计划来看的话,一致性读的次数分别为3和4。